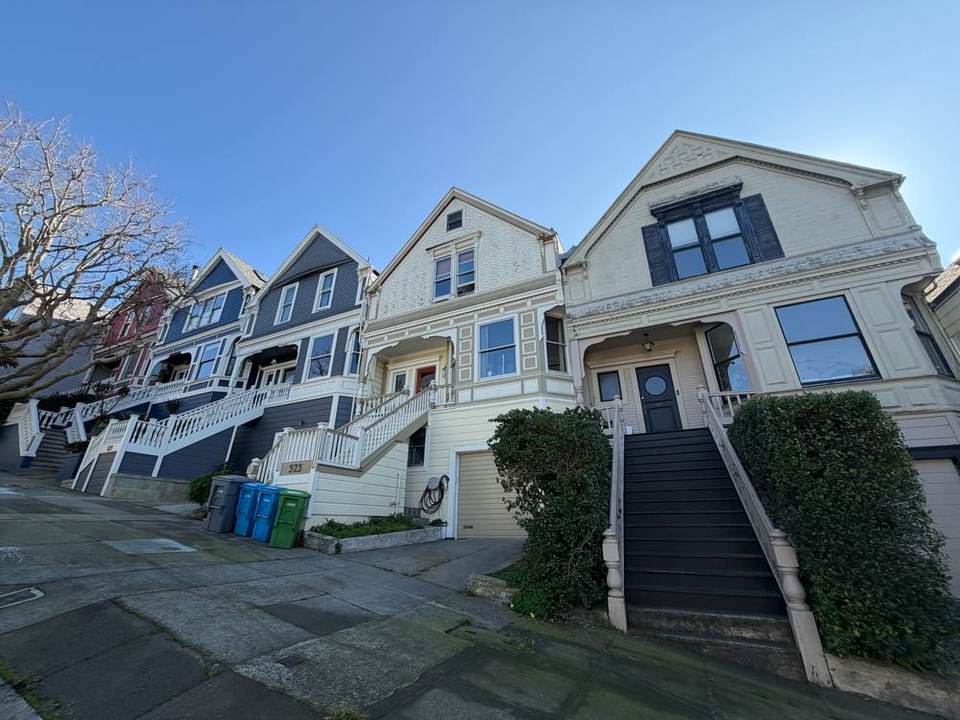
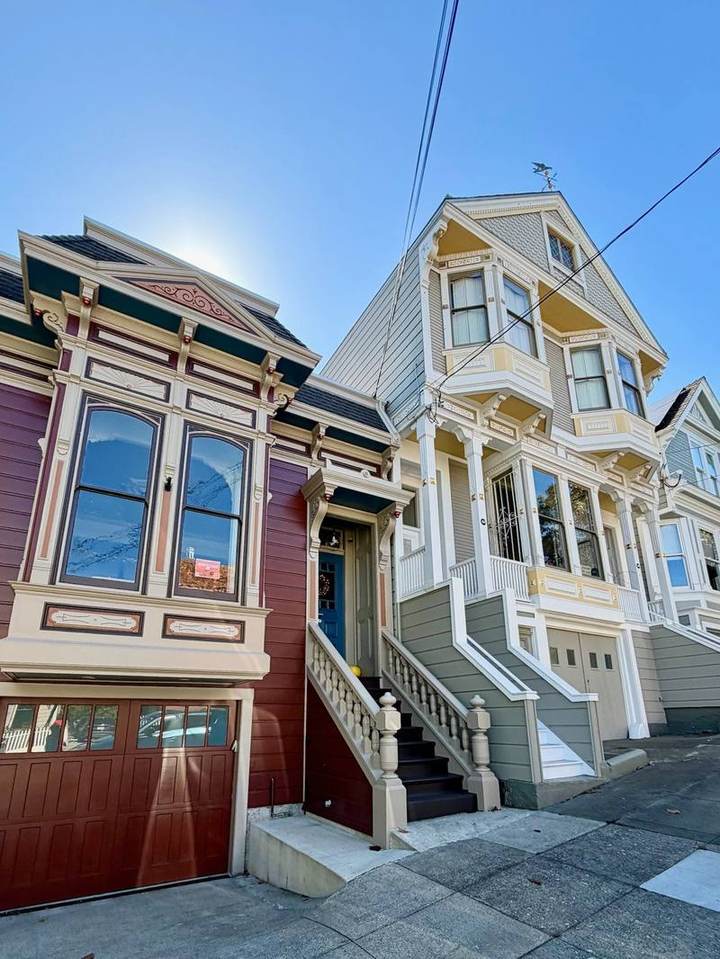
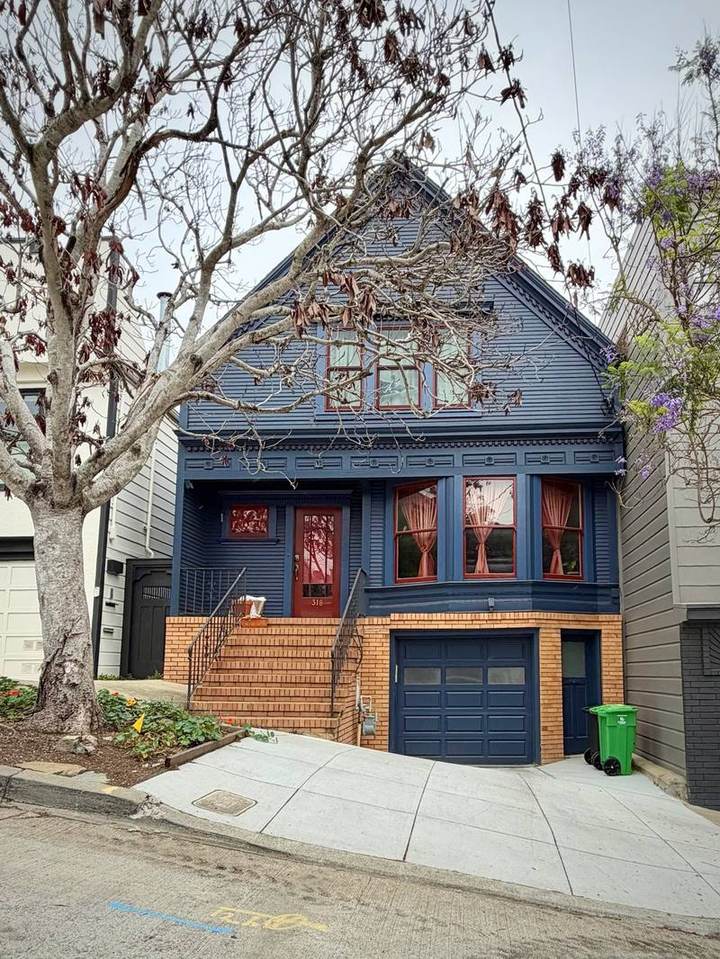
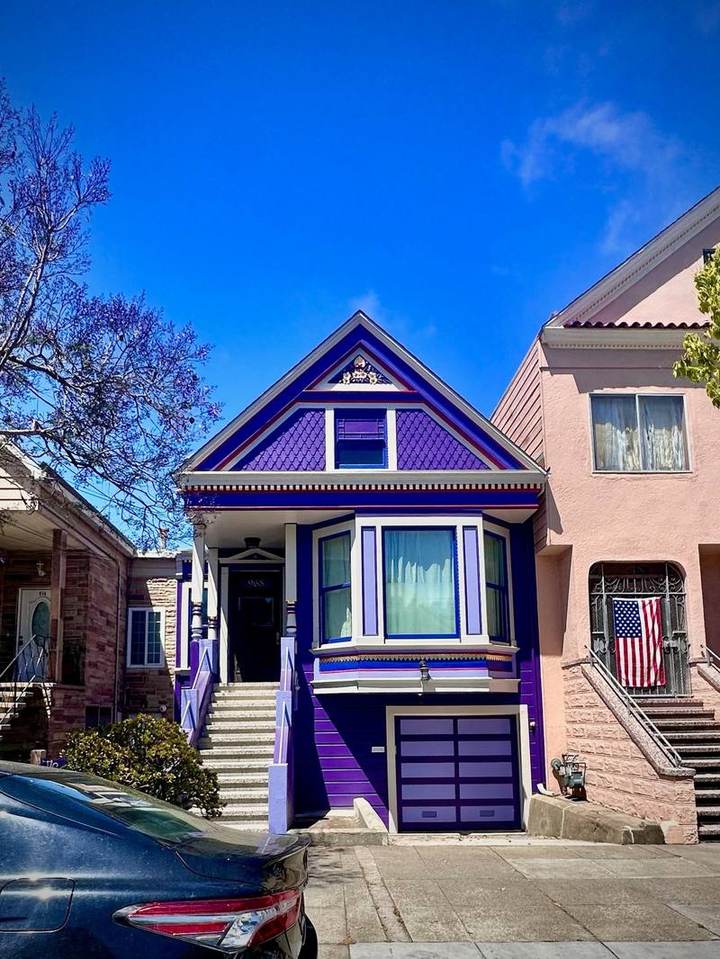
Serving Noe Valley, the Castro, Cole Valley, Glen Park and all of San Francisco
Sources: San Francisco MLS — 1,832 District 5 sales closed January 1, 2024 through September 17, 2026 after removing two duplicate records: 797 single-family houses, 818 condominiums, 204 tenancies in common and 13 townhouse, co-op and other units, analyzed by Team K.Ho. Houses, condominiums and TICs are never blended; unless a figure is labeled condominium or TIC, it is single-family. 2026 figures run January 1 through September 17 and are compared with full prior years and, where stated, the same prior-year window. Over-list amounts are median dollars above list across all sales in a group unless noted. Price per sqft uses MLS living area, reported for roughly 86–93% of sales.
Long-run house figures, 2001–2023: Team K.Ho's archive of San Francisco MLS residential sales, covering 8,428 District 5 single-family houses and 60,379 across the City's ten districts. The archive doesn't carry the MLS property type, so a sale counts as a house when the record shows no unit number, no association fee, no condominium-only parking and no more than one unit. Checked against 2024 and 2025, where the MLS property type is known, that rule matched 765 of 769 houses with one false match. Before 2004 the MLS recorded unit counts less consistently, so a few condominiums may sit in the earliest house figures; setting aside the doubtful records moves no year's median by more than 3%. The 2024–2026 rows are the figures used throughout this page, and City figures for those years apply the same rule to every district. Short sales and bank-owned sales are as flagged in the MLS special listing conditions. Price per sqft uses MLS living area where reported, 65–93% of houses depending on the year.
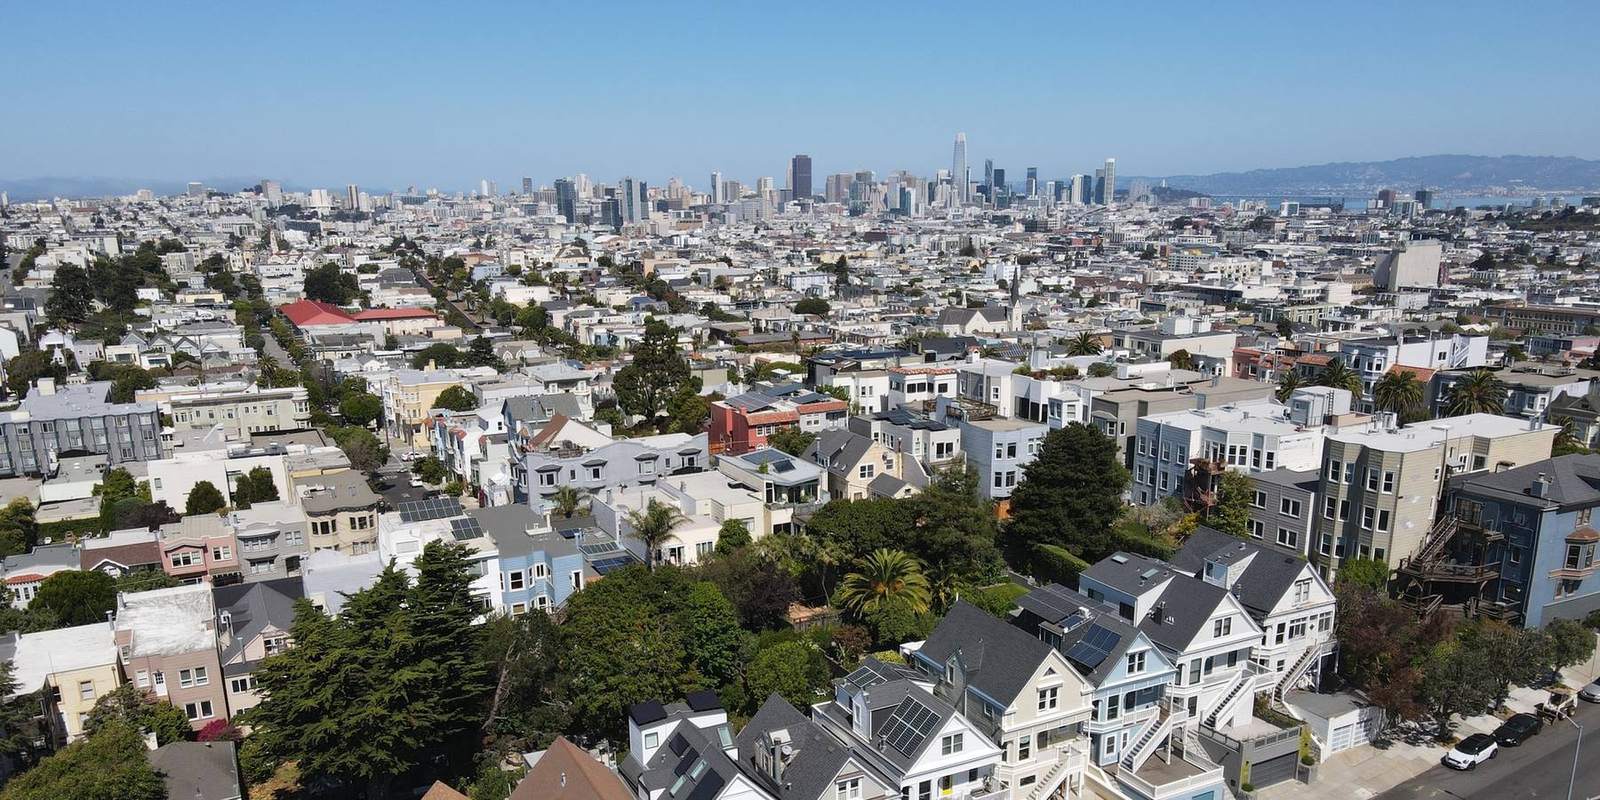
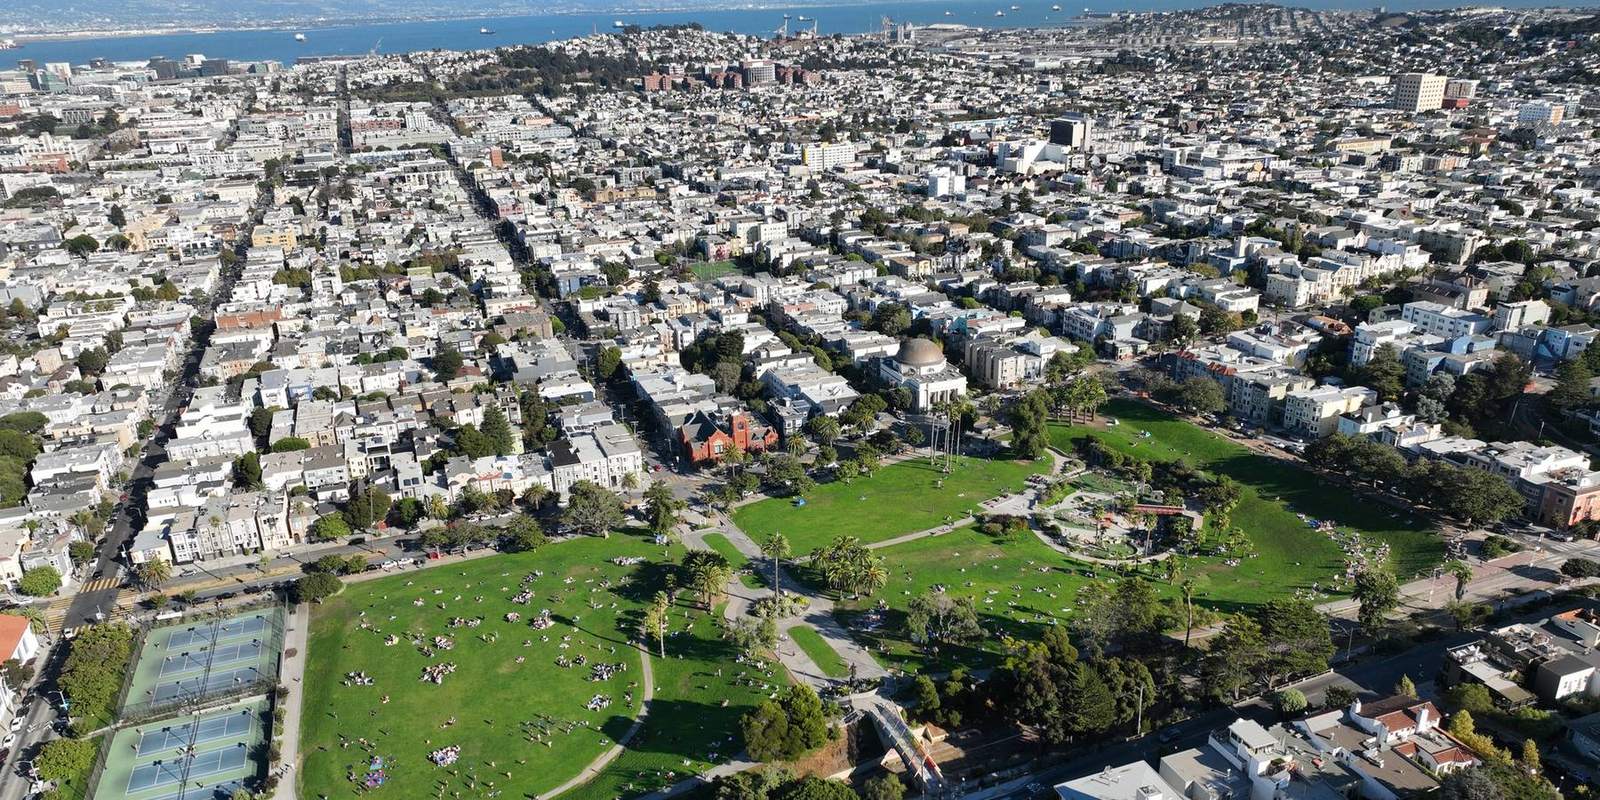
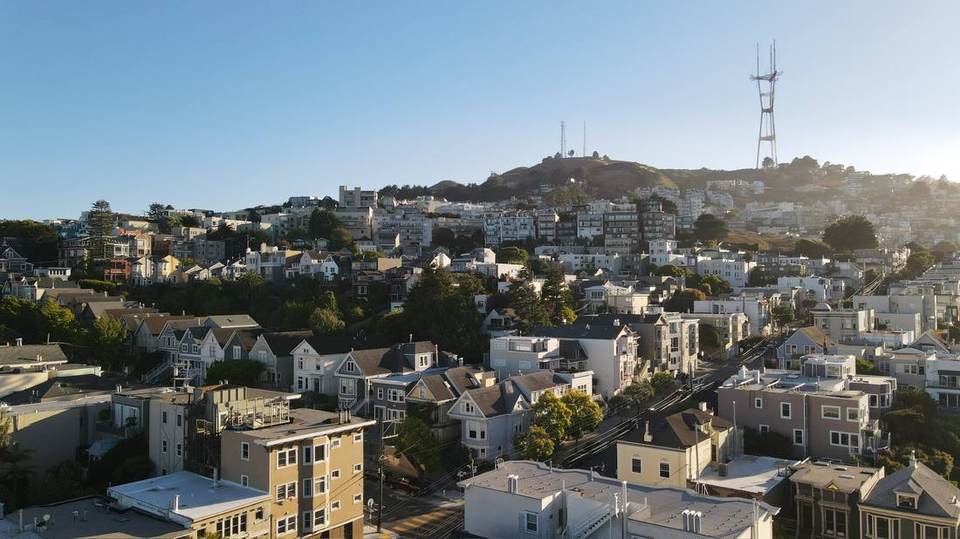
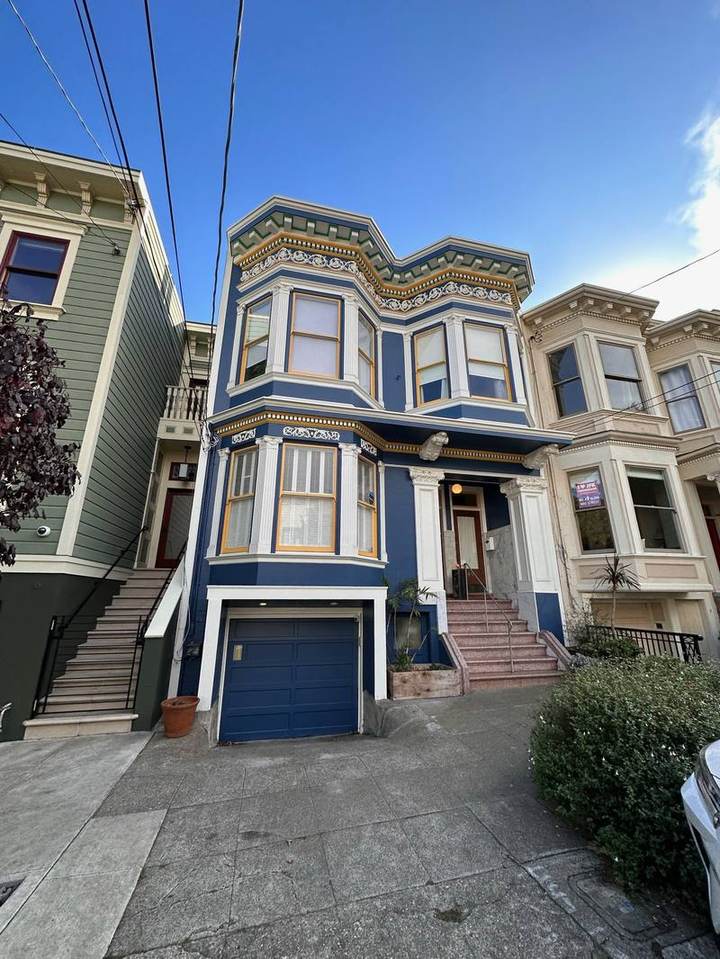
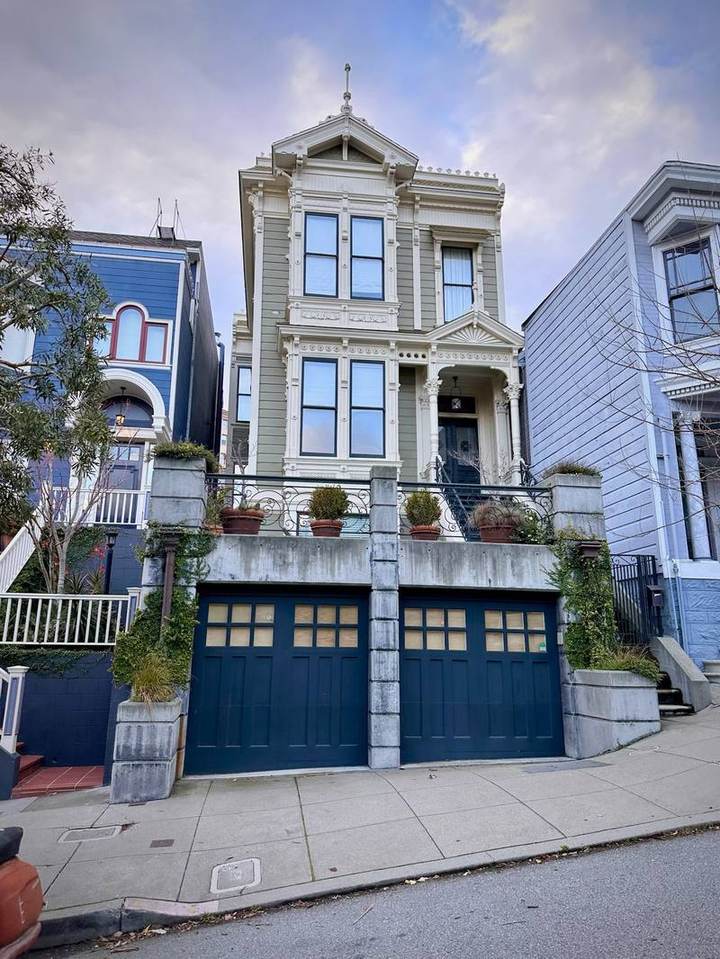
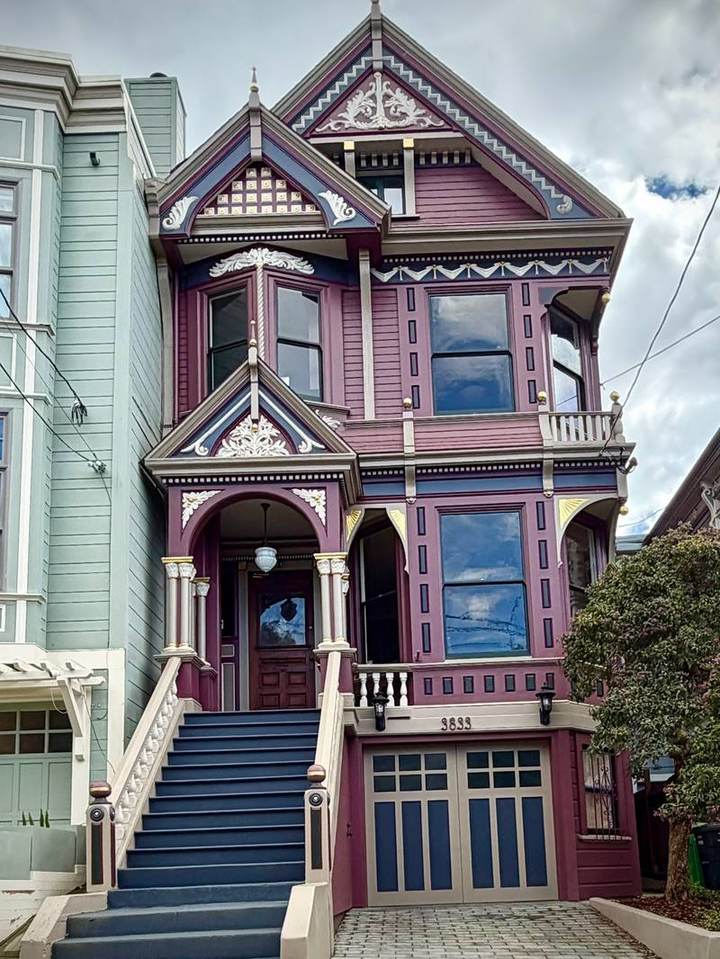
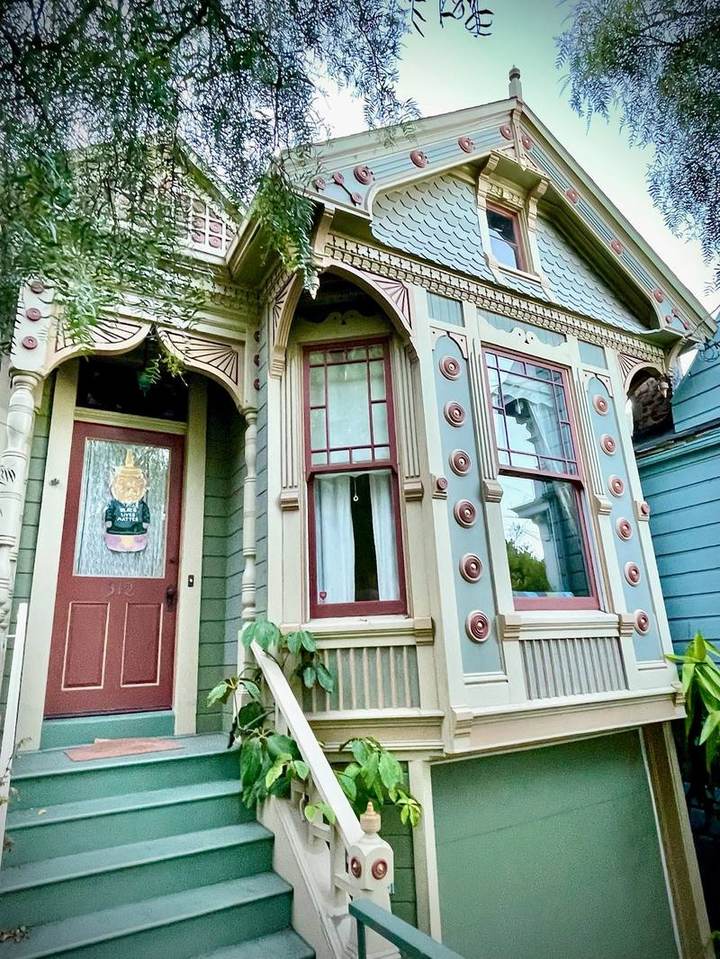
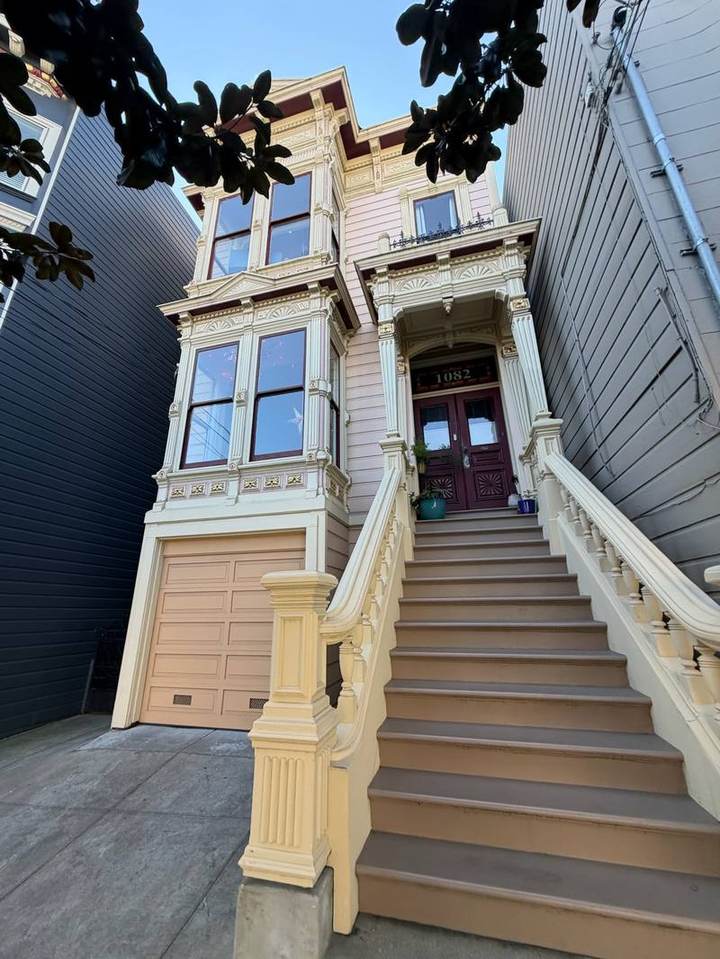
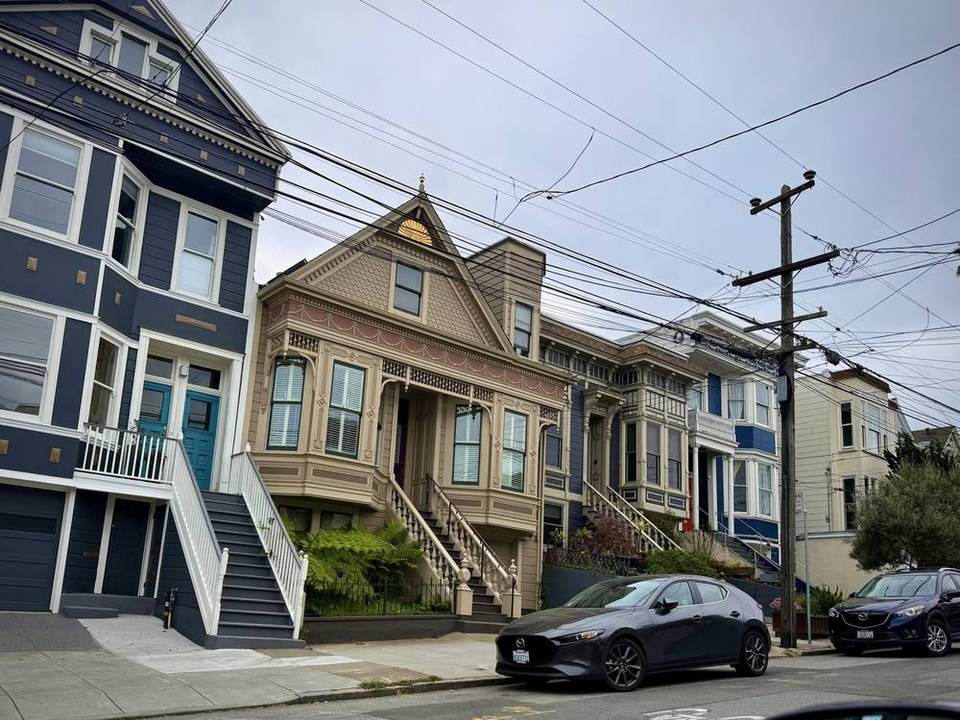
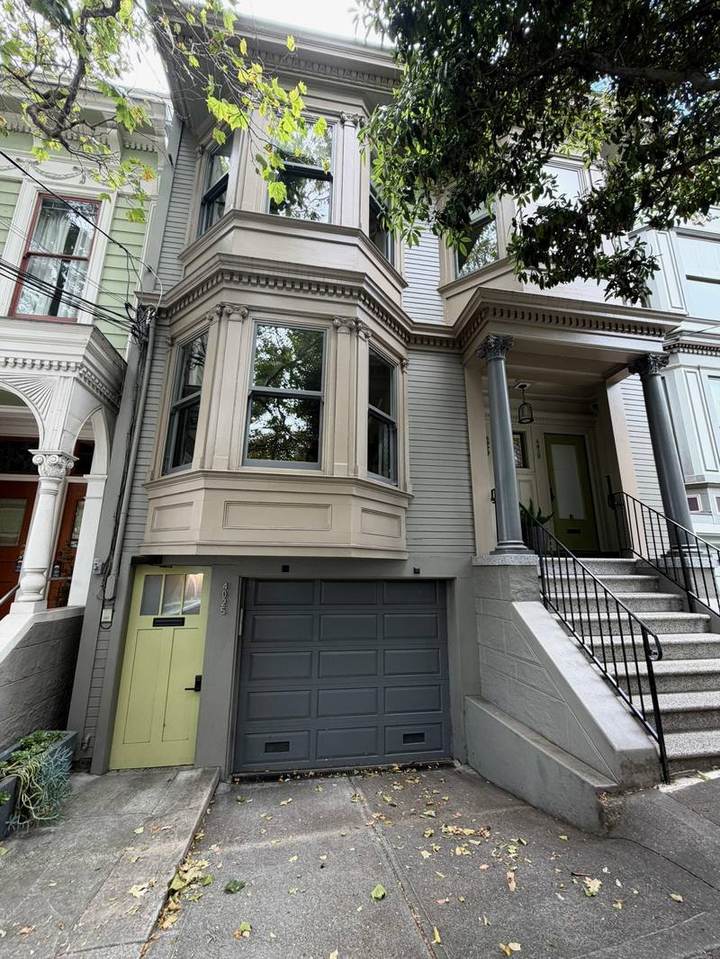
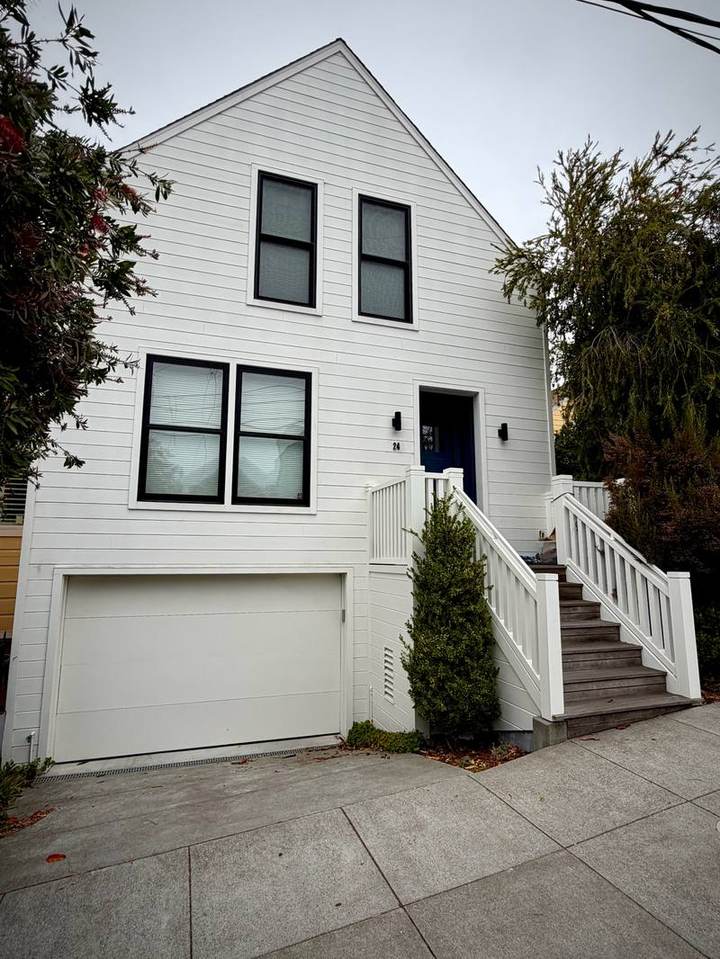
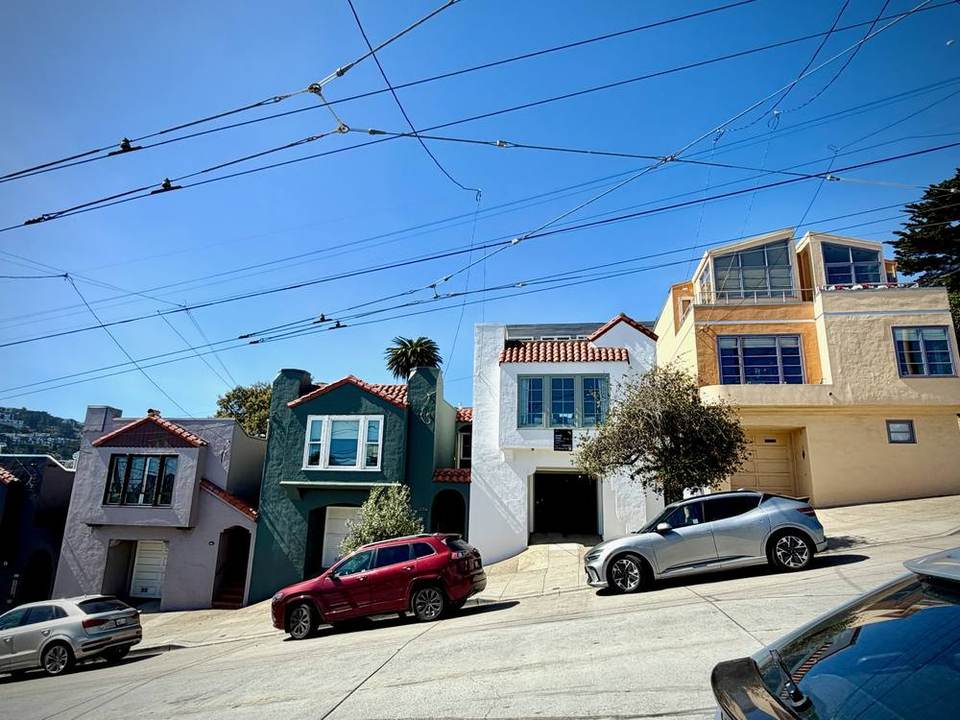
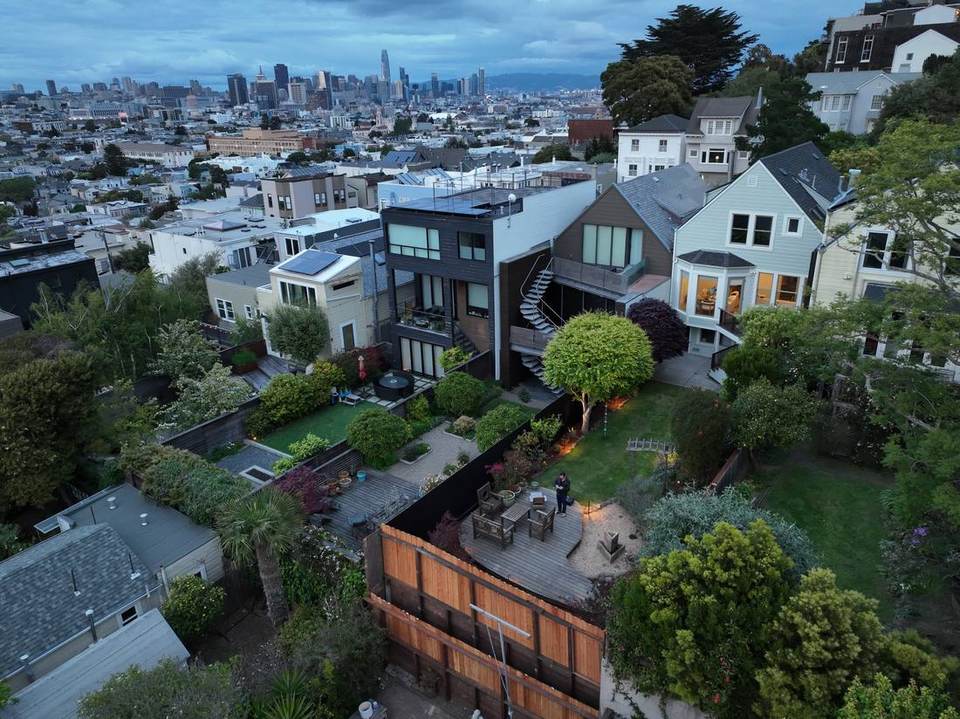
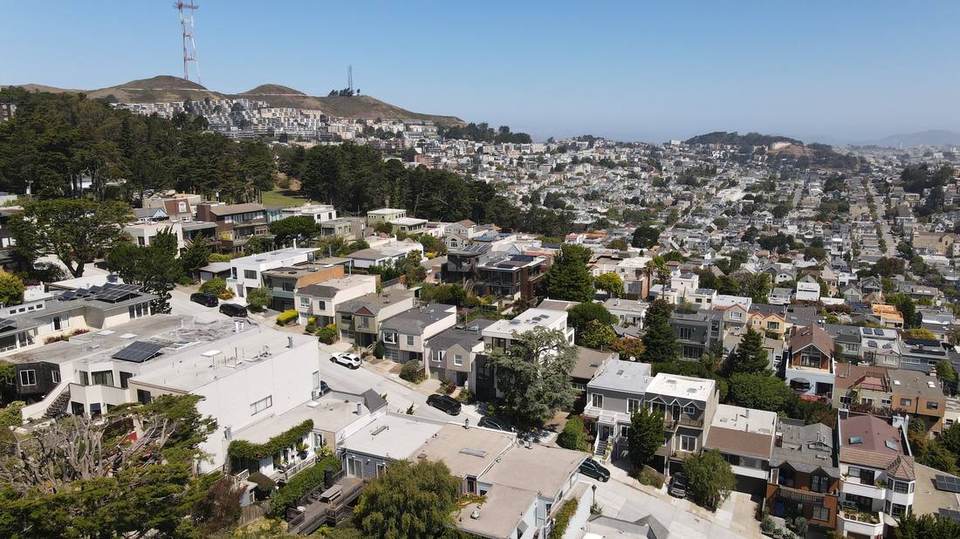
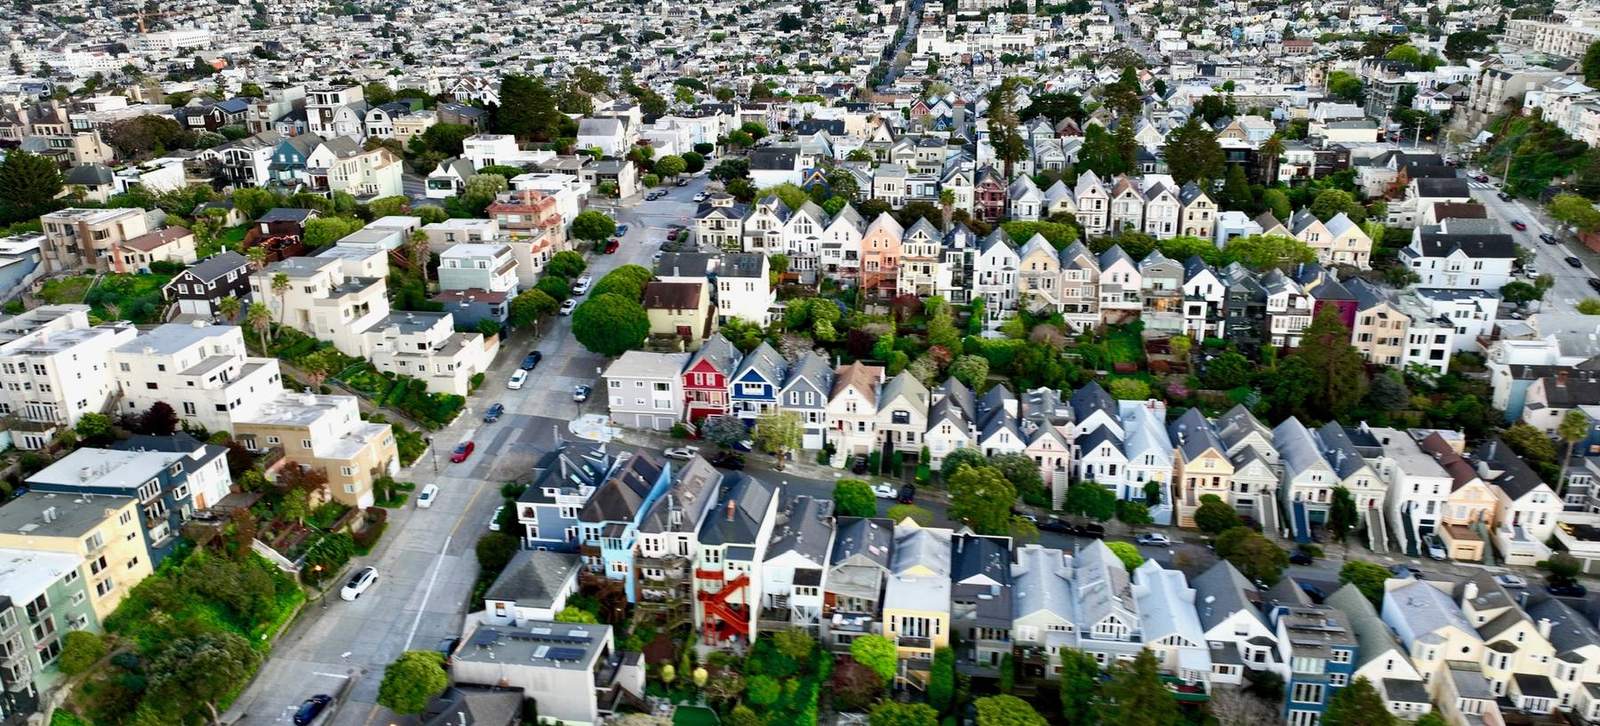
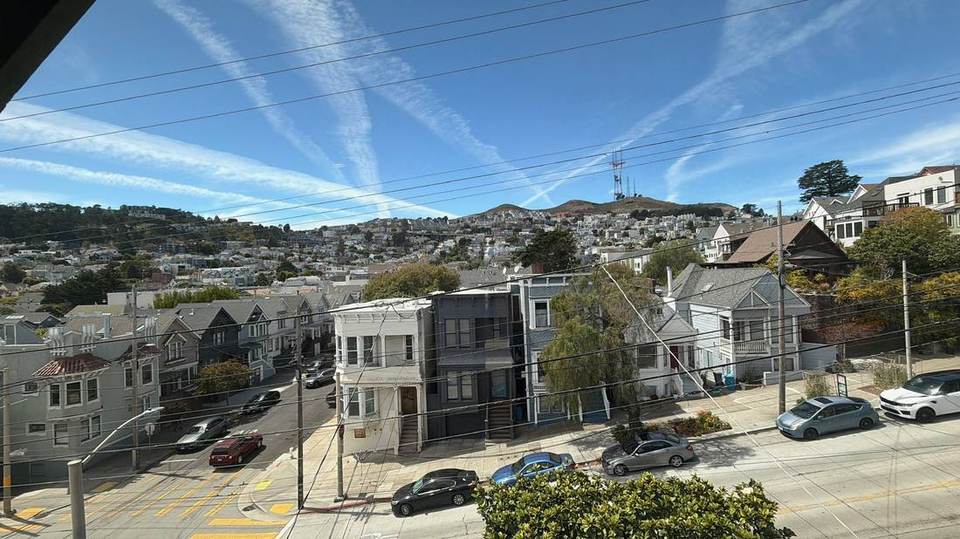
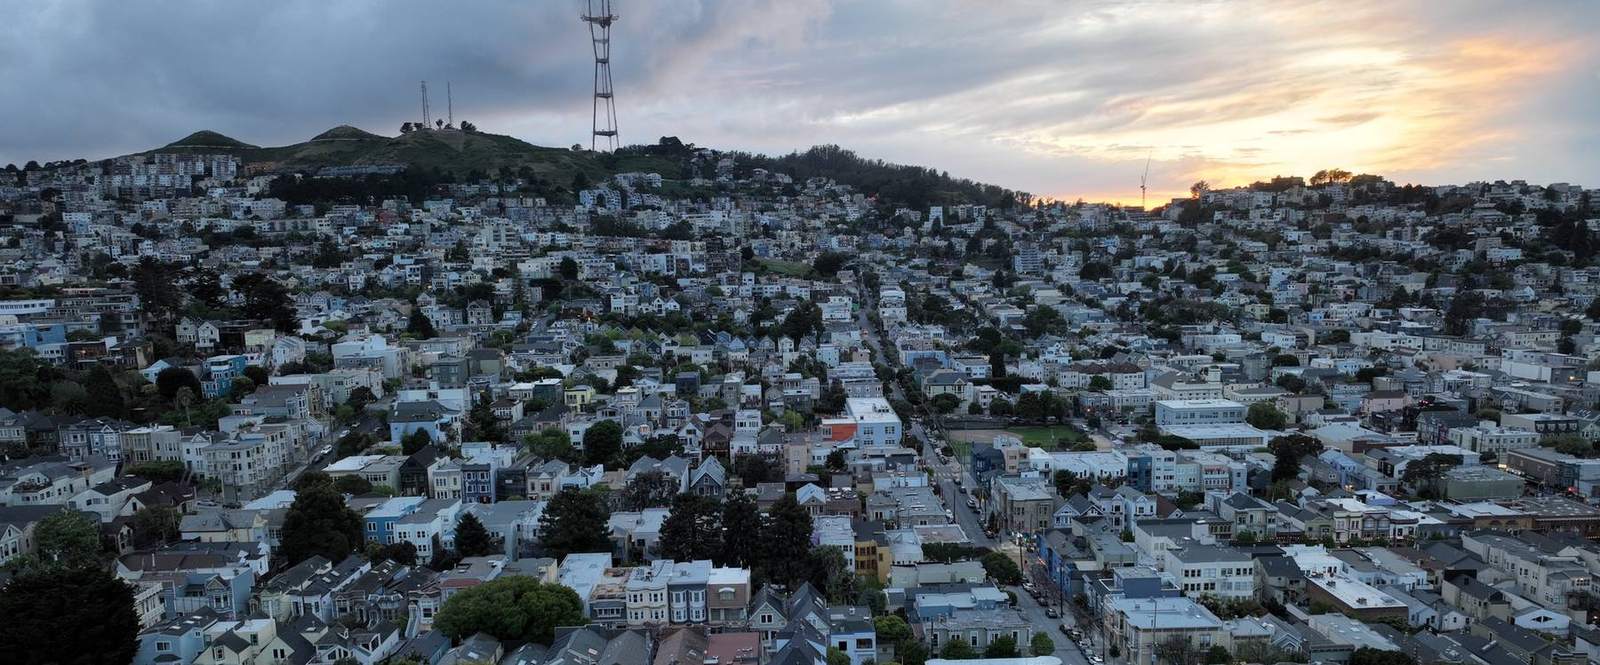
Subdistrict and property type come from the MLS for the 1,331 sales in Team K.Ho's February 2024–February 2026 export. The rest were assigned to subdistricts by street and address position and classified from address, unit count, association fee and parking fields; that separates houses from units reliably but condominiums from TICs less so, which is why 2026 TIC figures are marked provisional. Financing is as reported to the MLS. District comparisons use the same classification for all ten districts. Rate data: Freddie Mac PMMS, week of September 24, 2026. Policy, transit and neighborhood items current as of September 24, 2026, sourced from SFMTA, Mission Local, GrowSF, Streetsblog San Francisco and the San Francisco Standard; items we could not confirm are flagged in the text. Photographs © Team K.Ho.
All information deemed reliable but not guaranteed and subject to revision. This is commentary and market observation, not an appraisal. Every property, seller and buyer is different, and nothing here substitutes for advice on your situation. Equal Housing Opportunity.