That $360,500 median over list is the number to sit with. It is not froth — it is the City’s convention of pricing below expected value doing its job: a printed list price is an invitation, not a prediction.
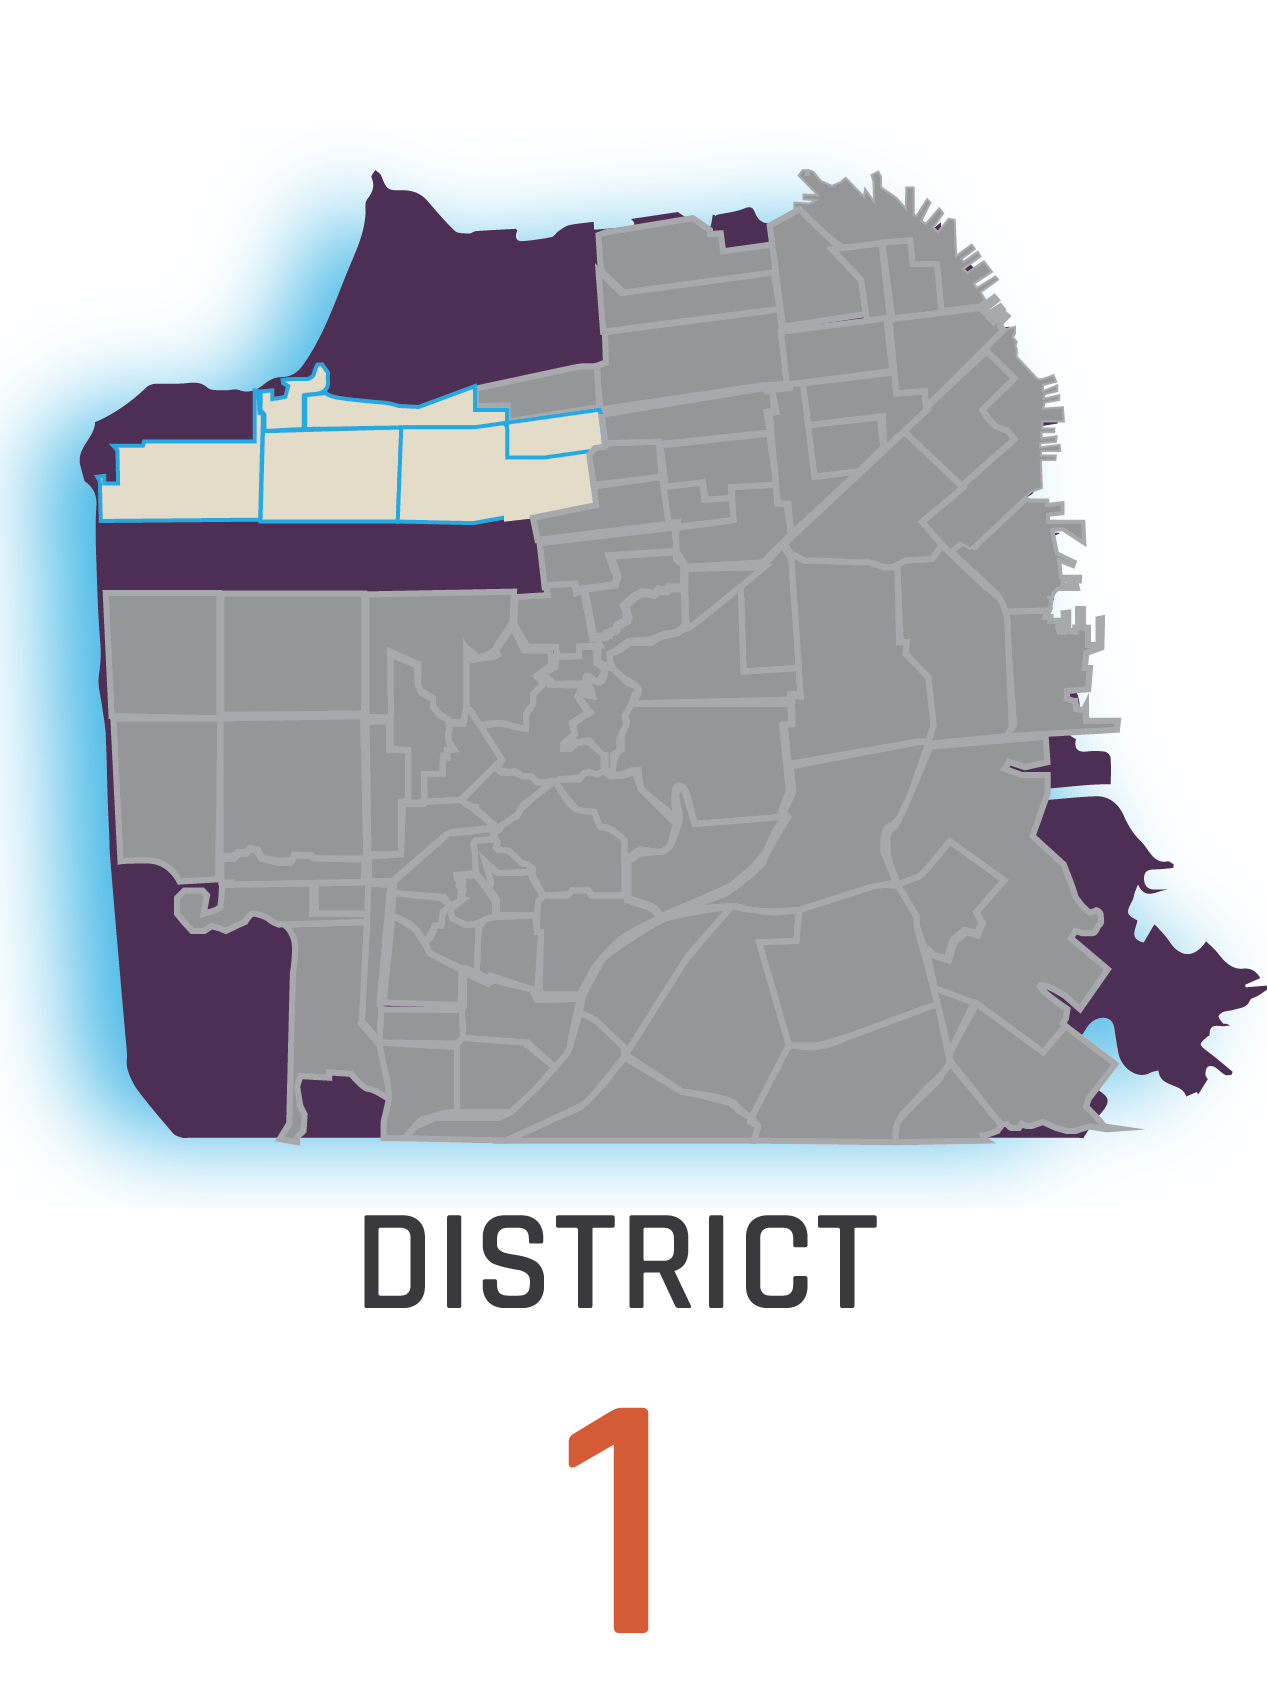
$2.49M

Team K.Ho · Vanguard Properties
The Headlines are mostly true: San Francisco’s Housing Market has been surging for the past year thanks a number of factors (the mayor, return to work, and AI money), but what does the fall 2026 and spring 2027 market hold?
Based on 4,898 closed sales · July 15, 2025 through July 16, 2026 · San Francisco MLS
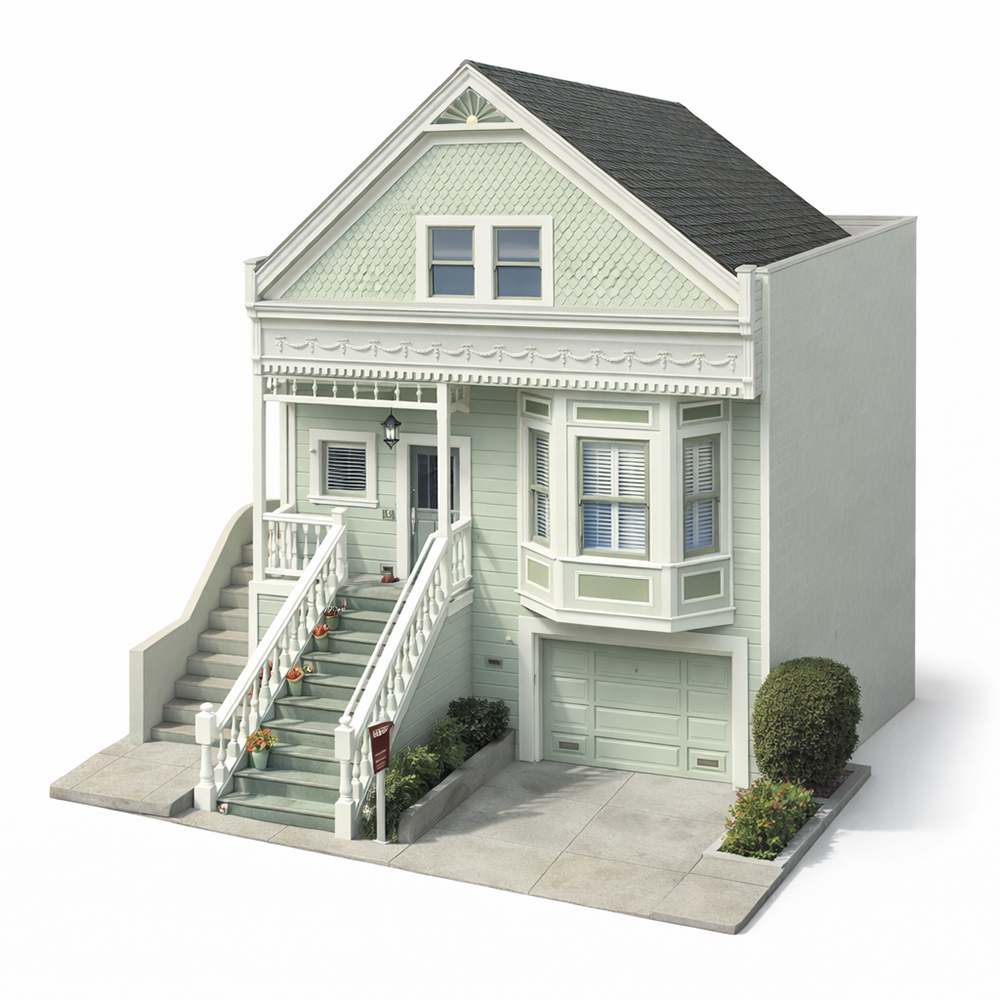
That $360,500 median over list is the number to sit with. It is not froth — it is the City’s convention of pricing below expected value doing its job: a printed list price is an invitation, not a prediction.
Noe Valley (5C): 110 houses closed this year at a $2.88M median — the deepest luxury-house market in the City.
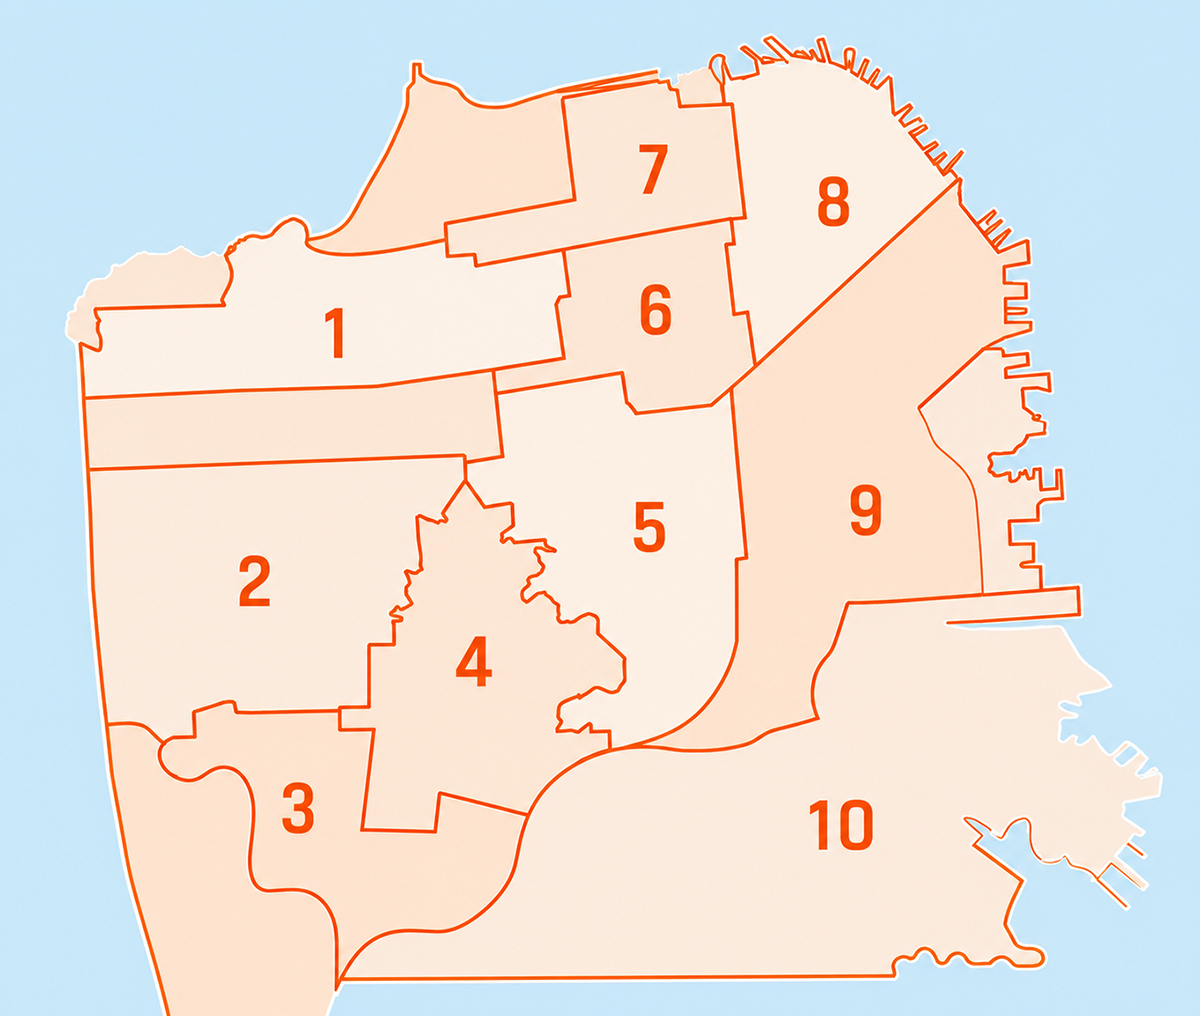
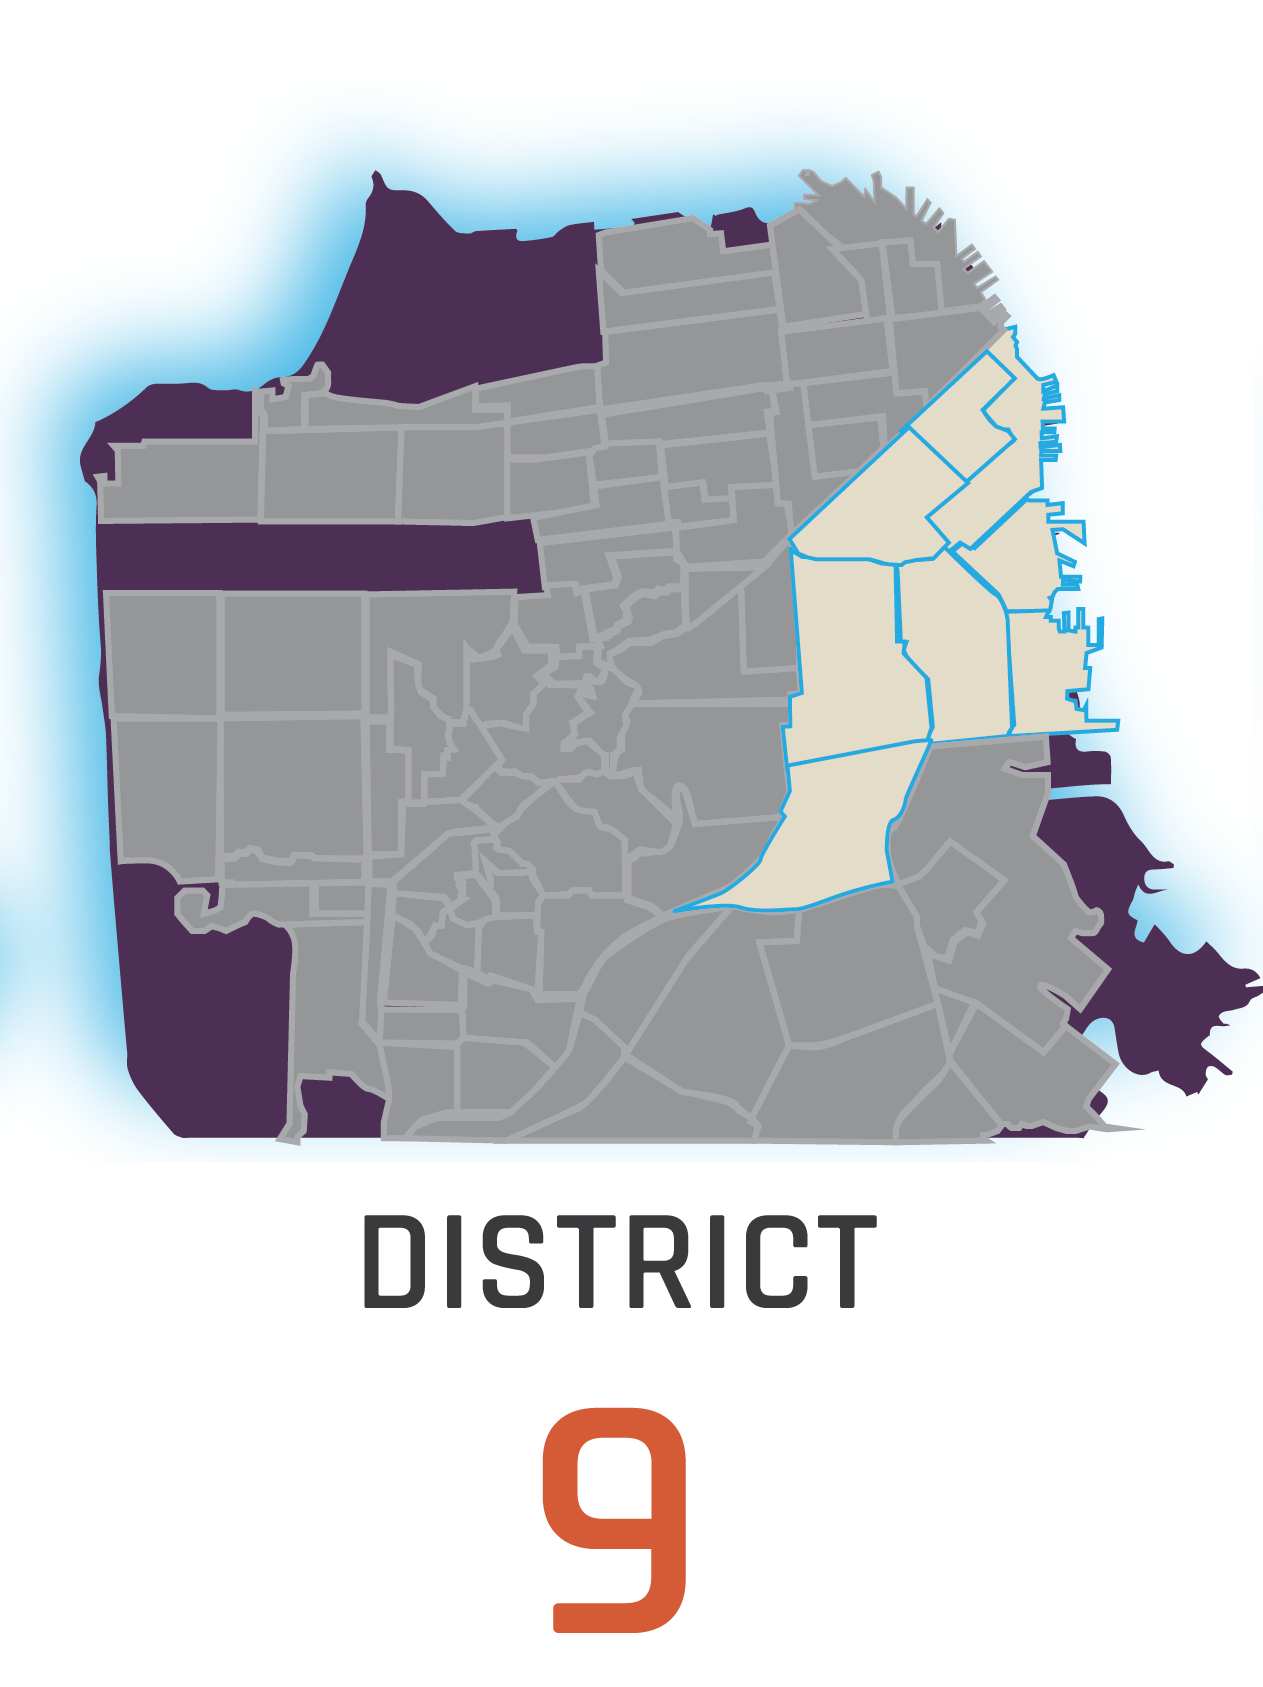
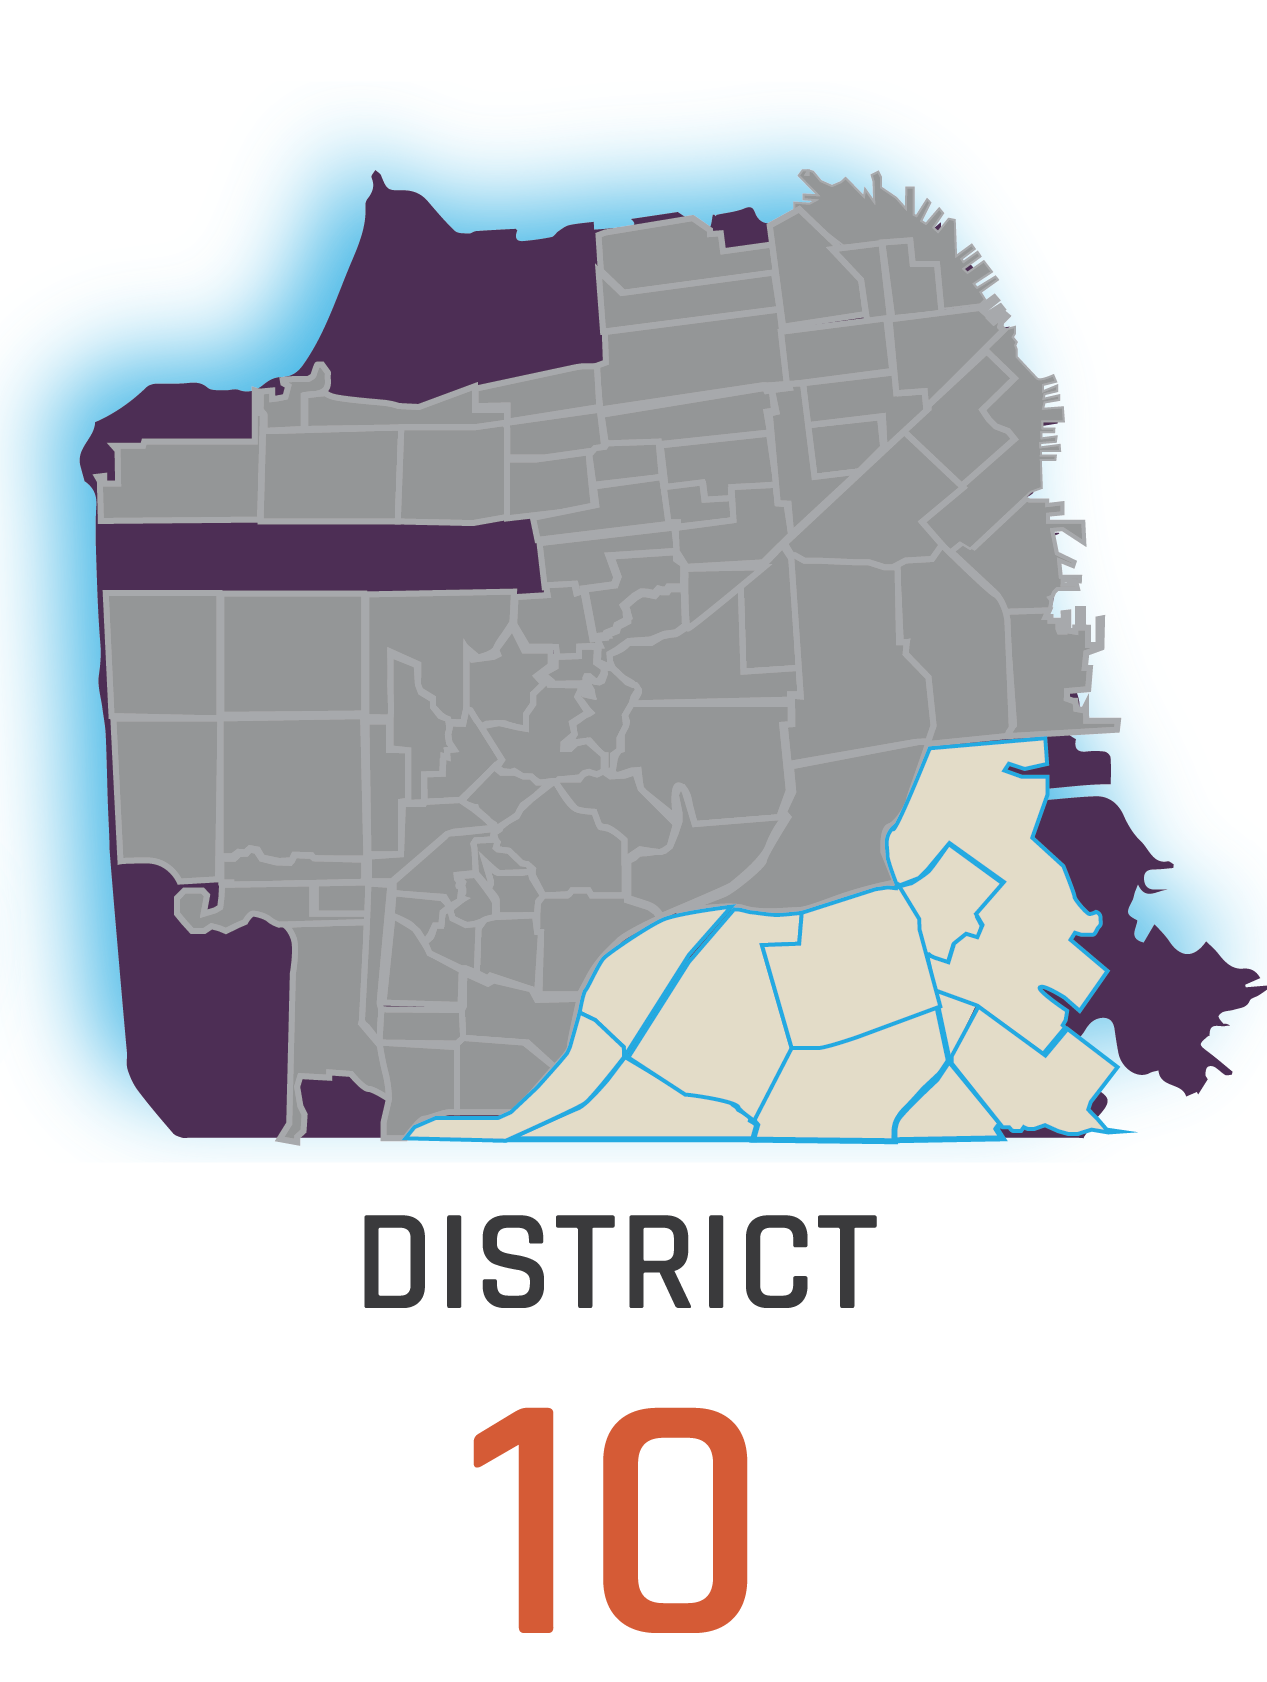
Ten MLS districts, dozens of subdistricts, and — as the fog chart below explains — several climates. Keep this map handy; everything that follows is keyed to it.
We once had clients who had no idea it would ever be foggy in San Francisco moving here from the Mid-Atlantic wanting a beach experience. We educated them on how our microclimates impact daily living (and home prices). They bought in San Jose.
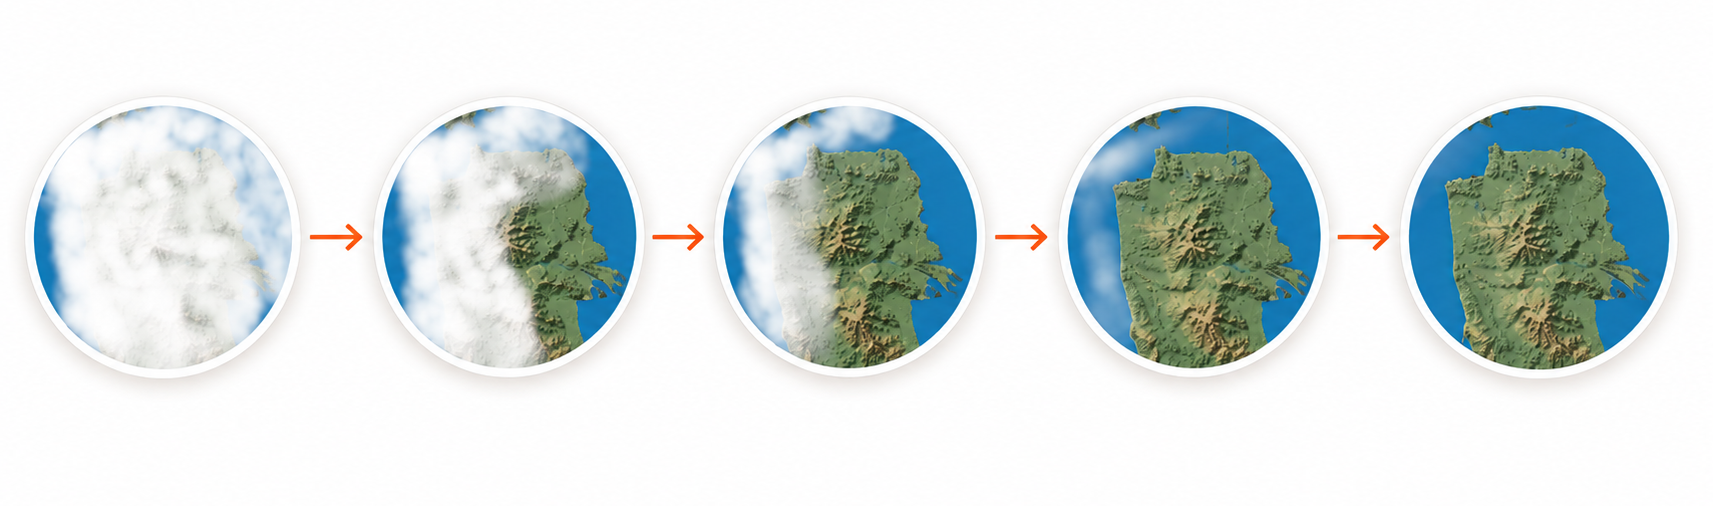
An extension of location! location! location! The most underappreciated factor about living here: The fog (aka Karl and/or the marine layer). The west side (Sunset, Richmond) lives under a marine layer most of the summer, while the east side (e.g., Mission, Bernal, Potrero) gets actual sun a lot of times while the west side is under the marine layer. But then again, there are many times where we are all bundling up in July while everyone else swelters. See fog.today for more.
$2.49M
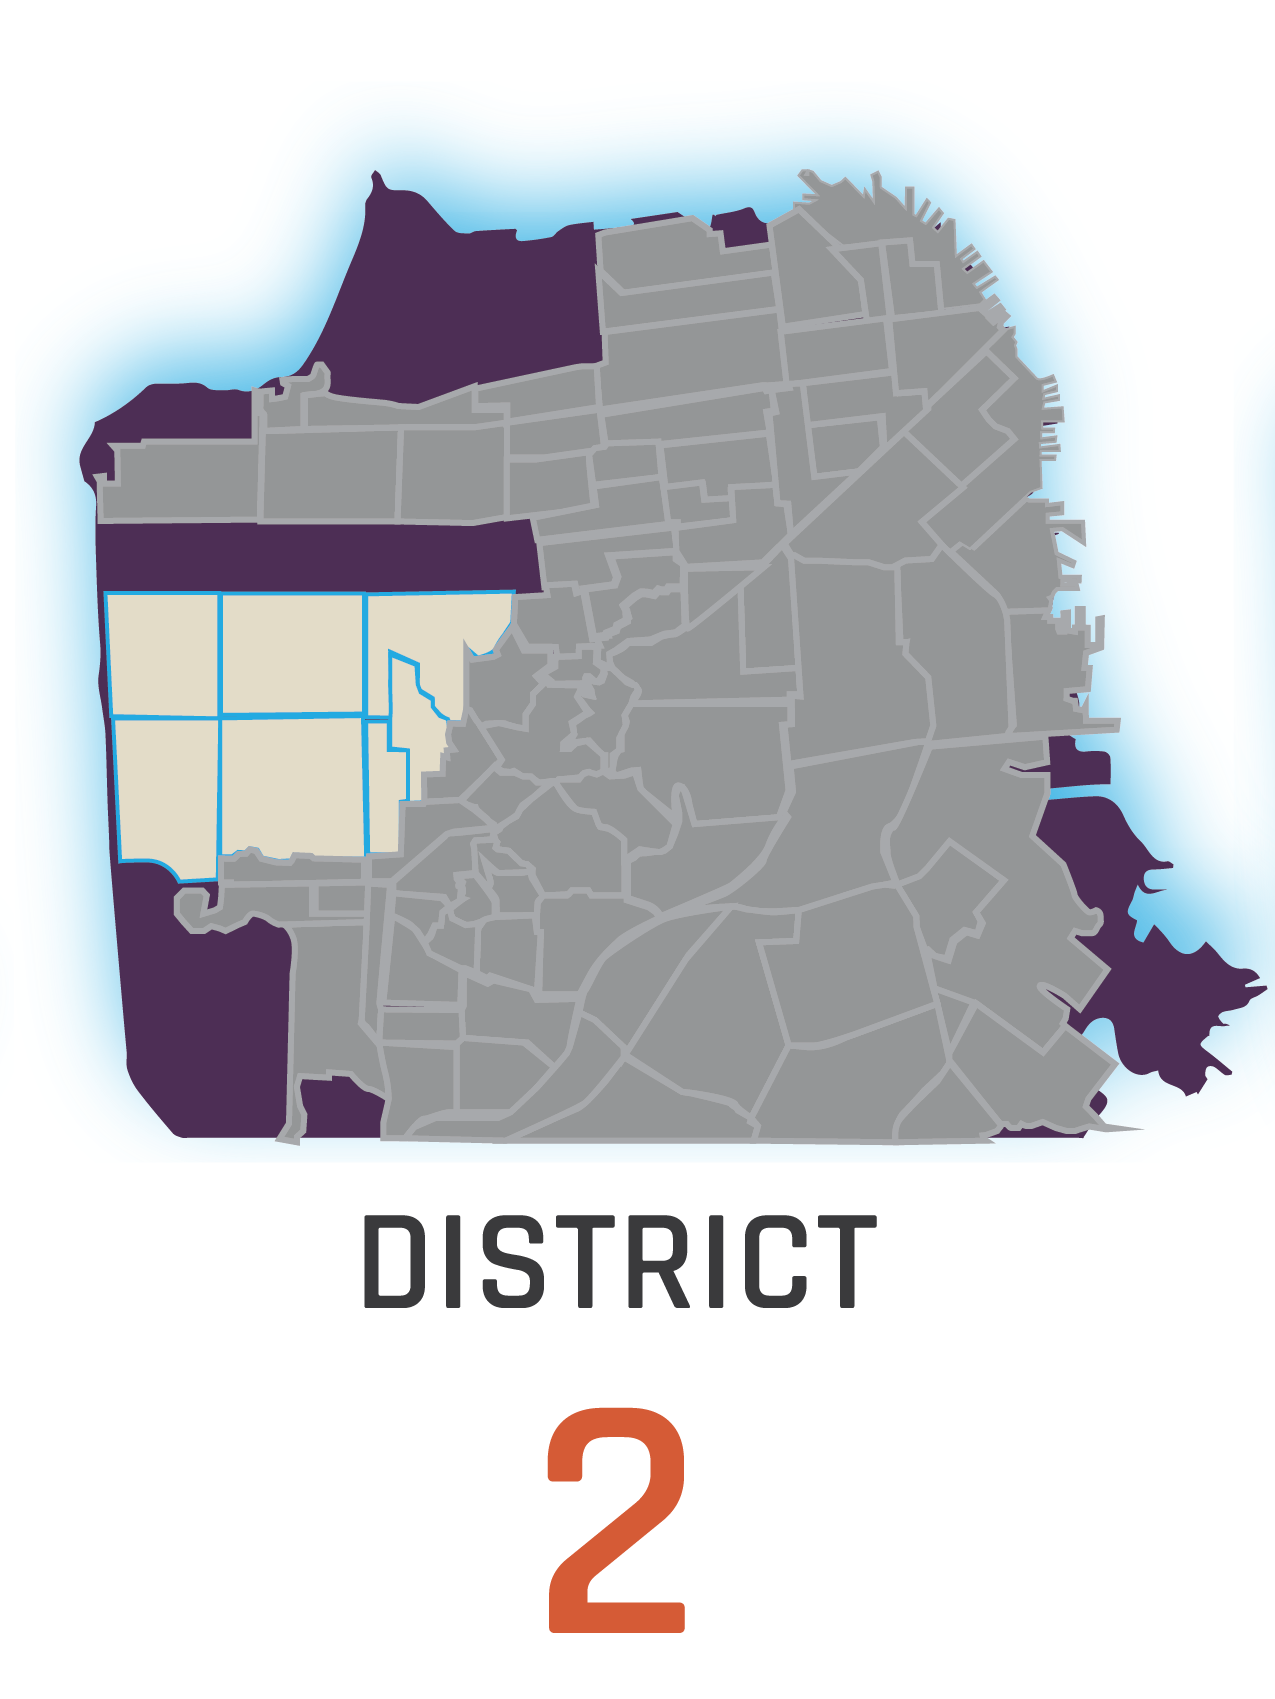
$1.80M
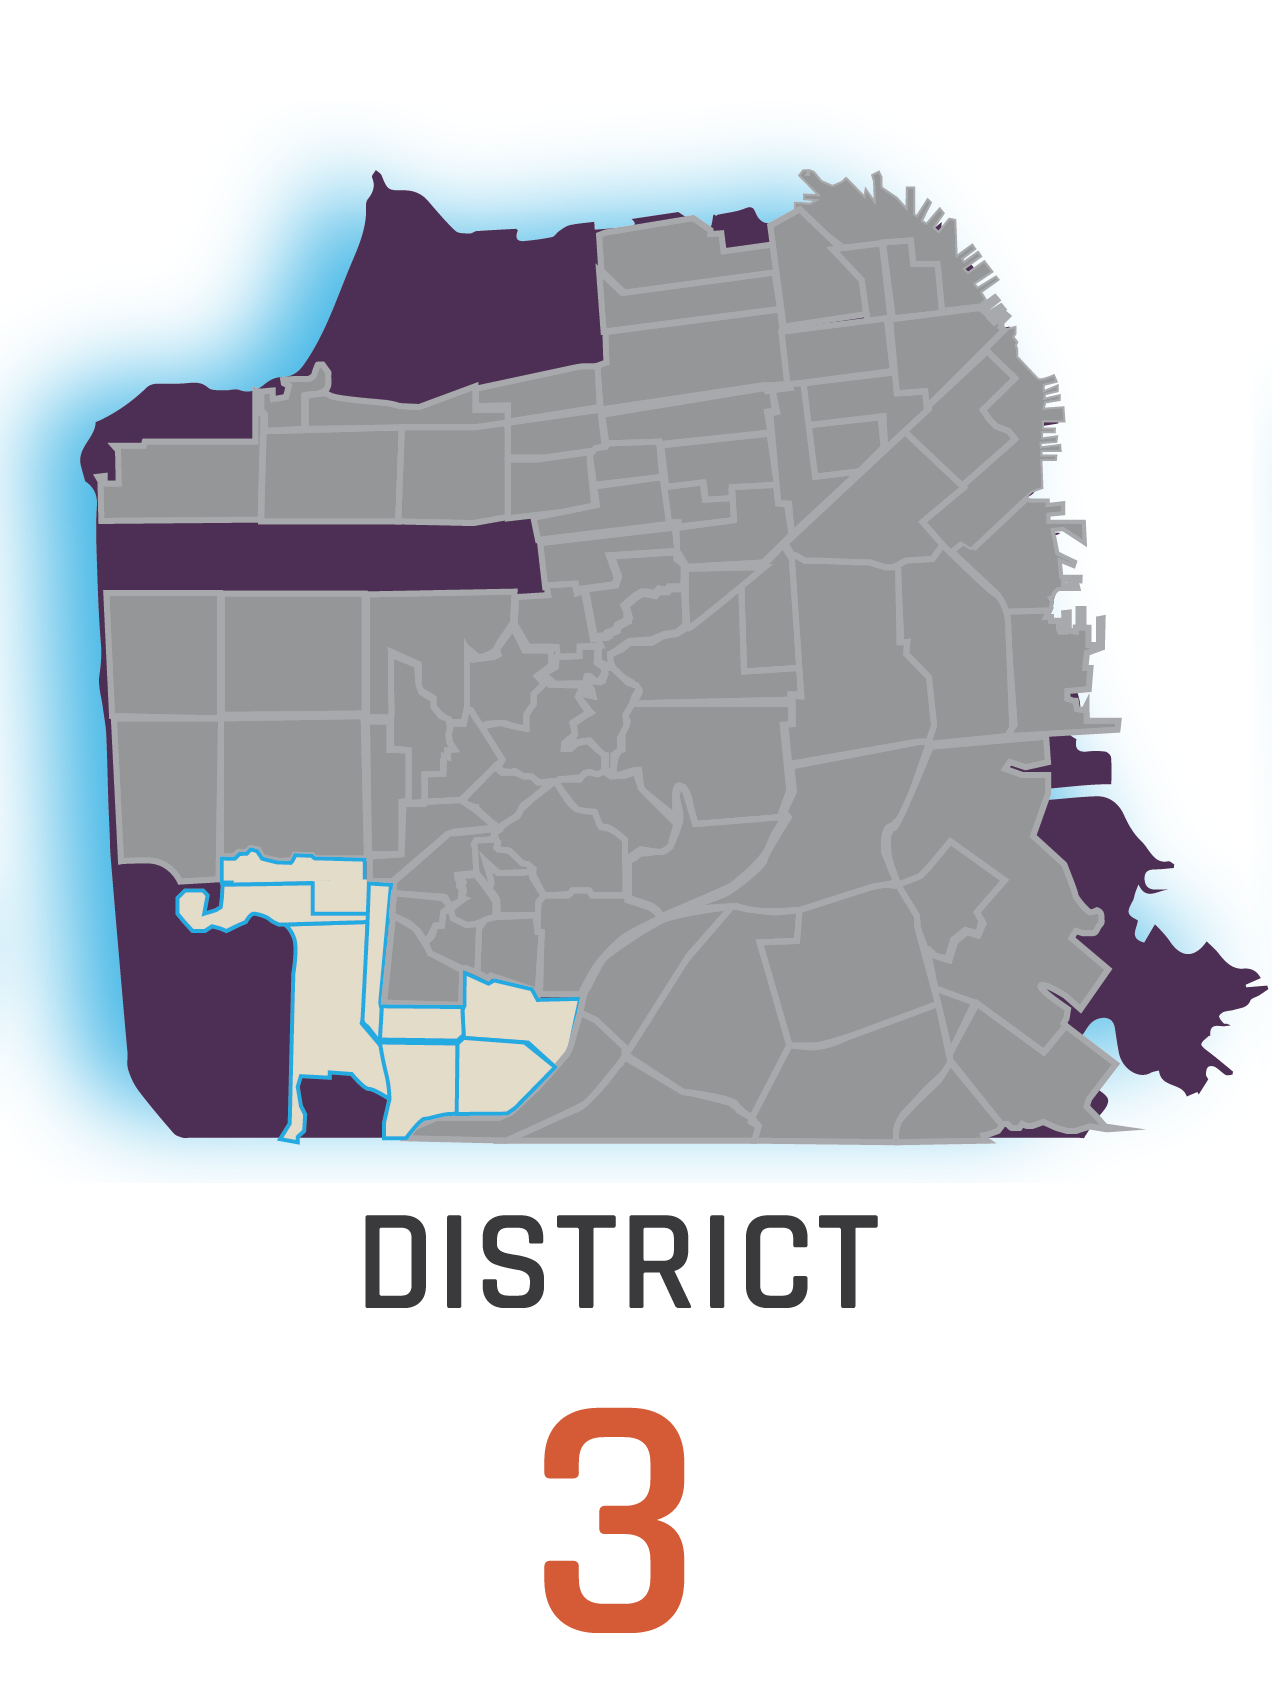
$1.40M
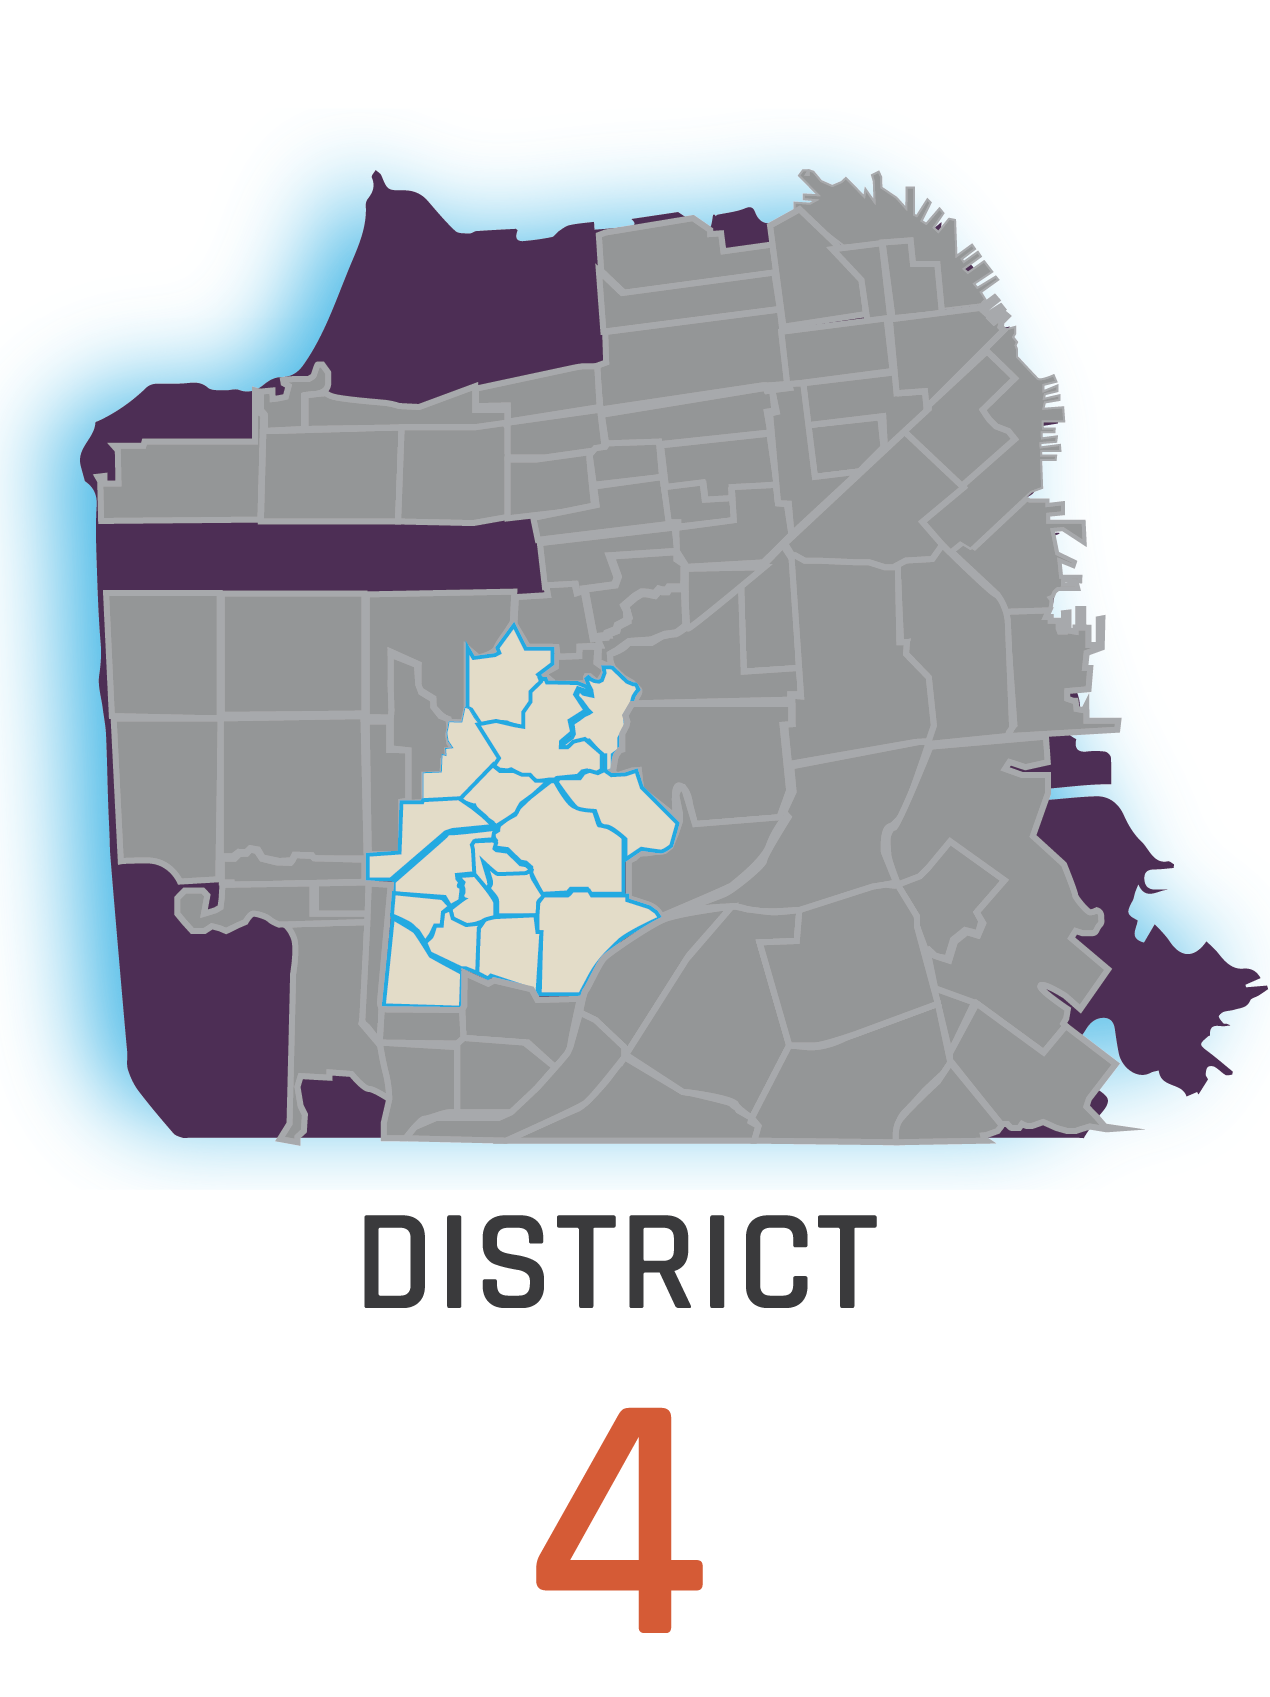
$2.25M
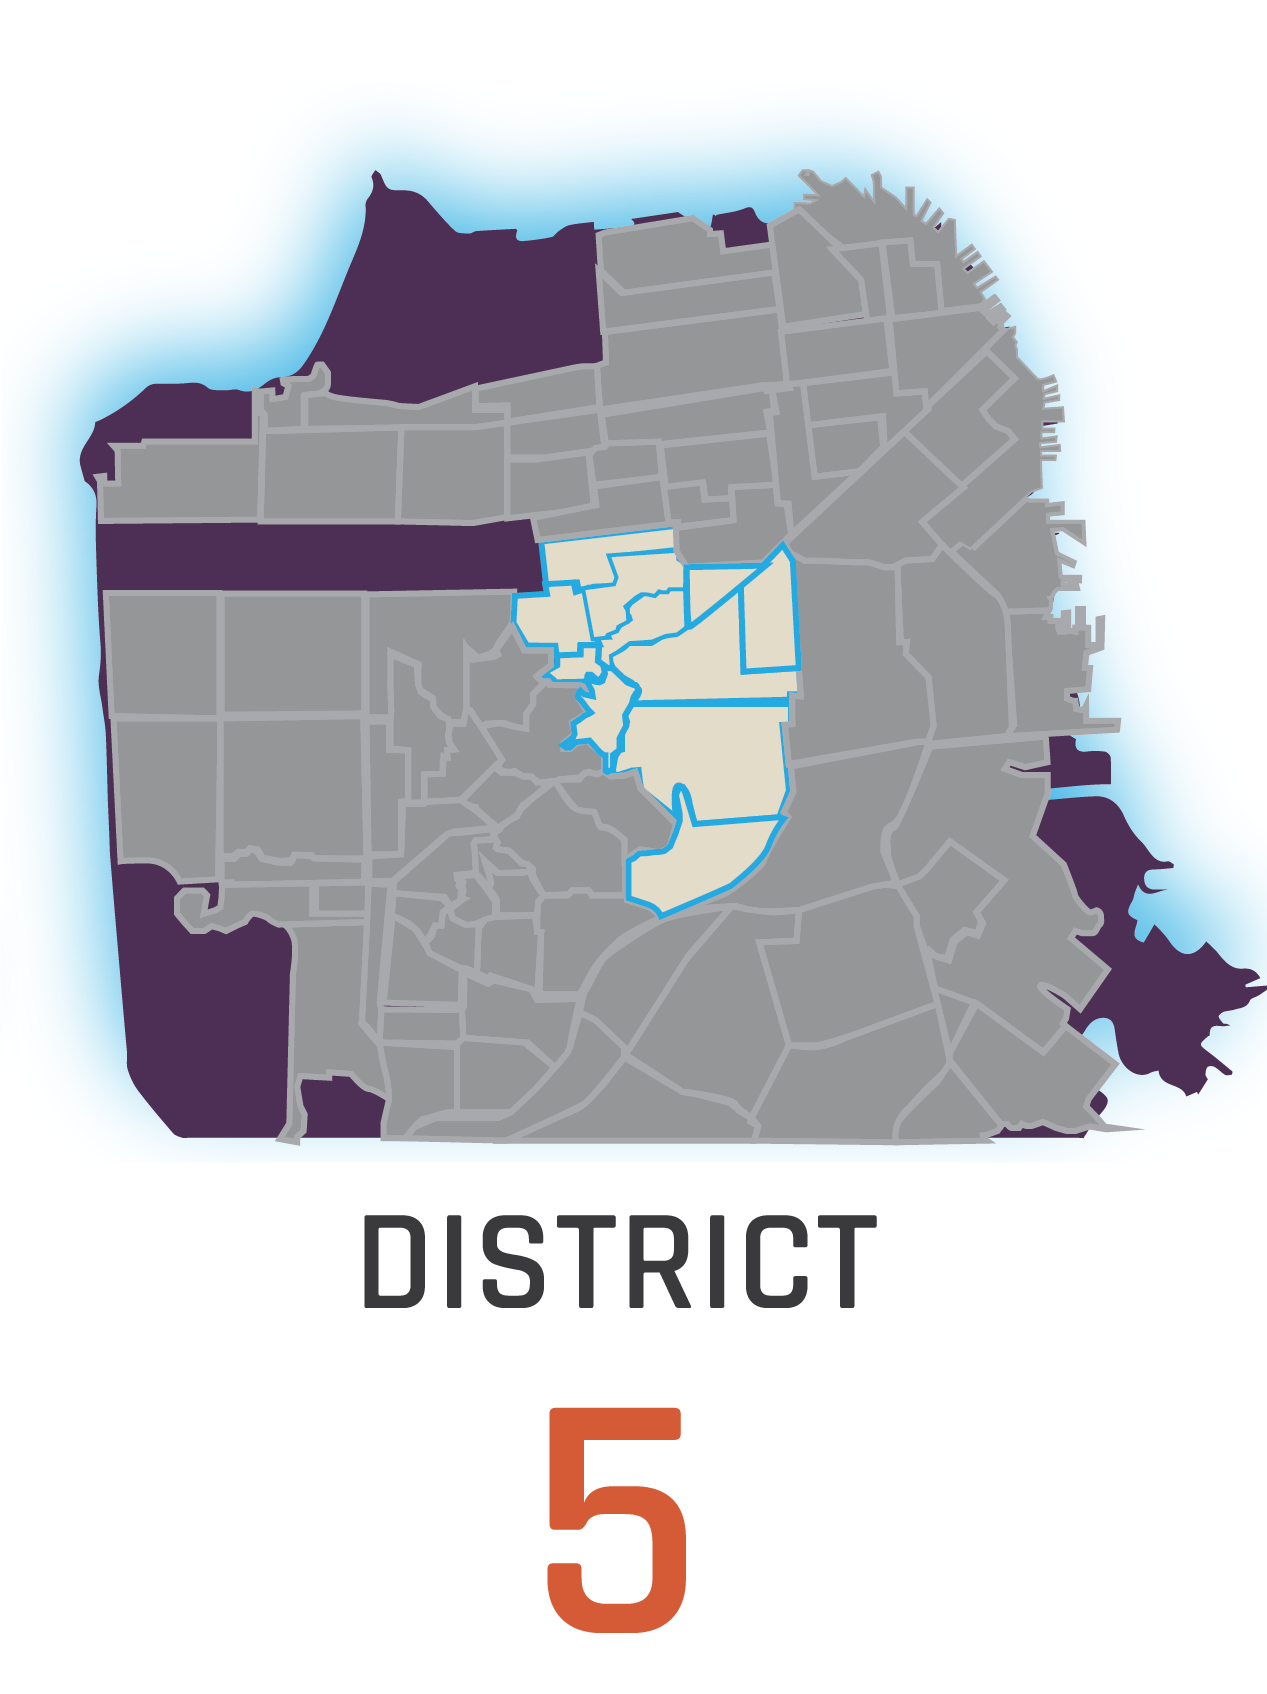
$2.80M
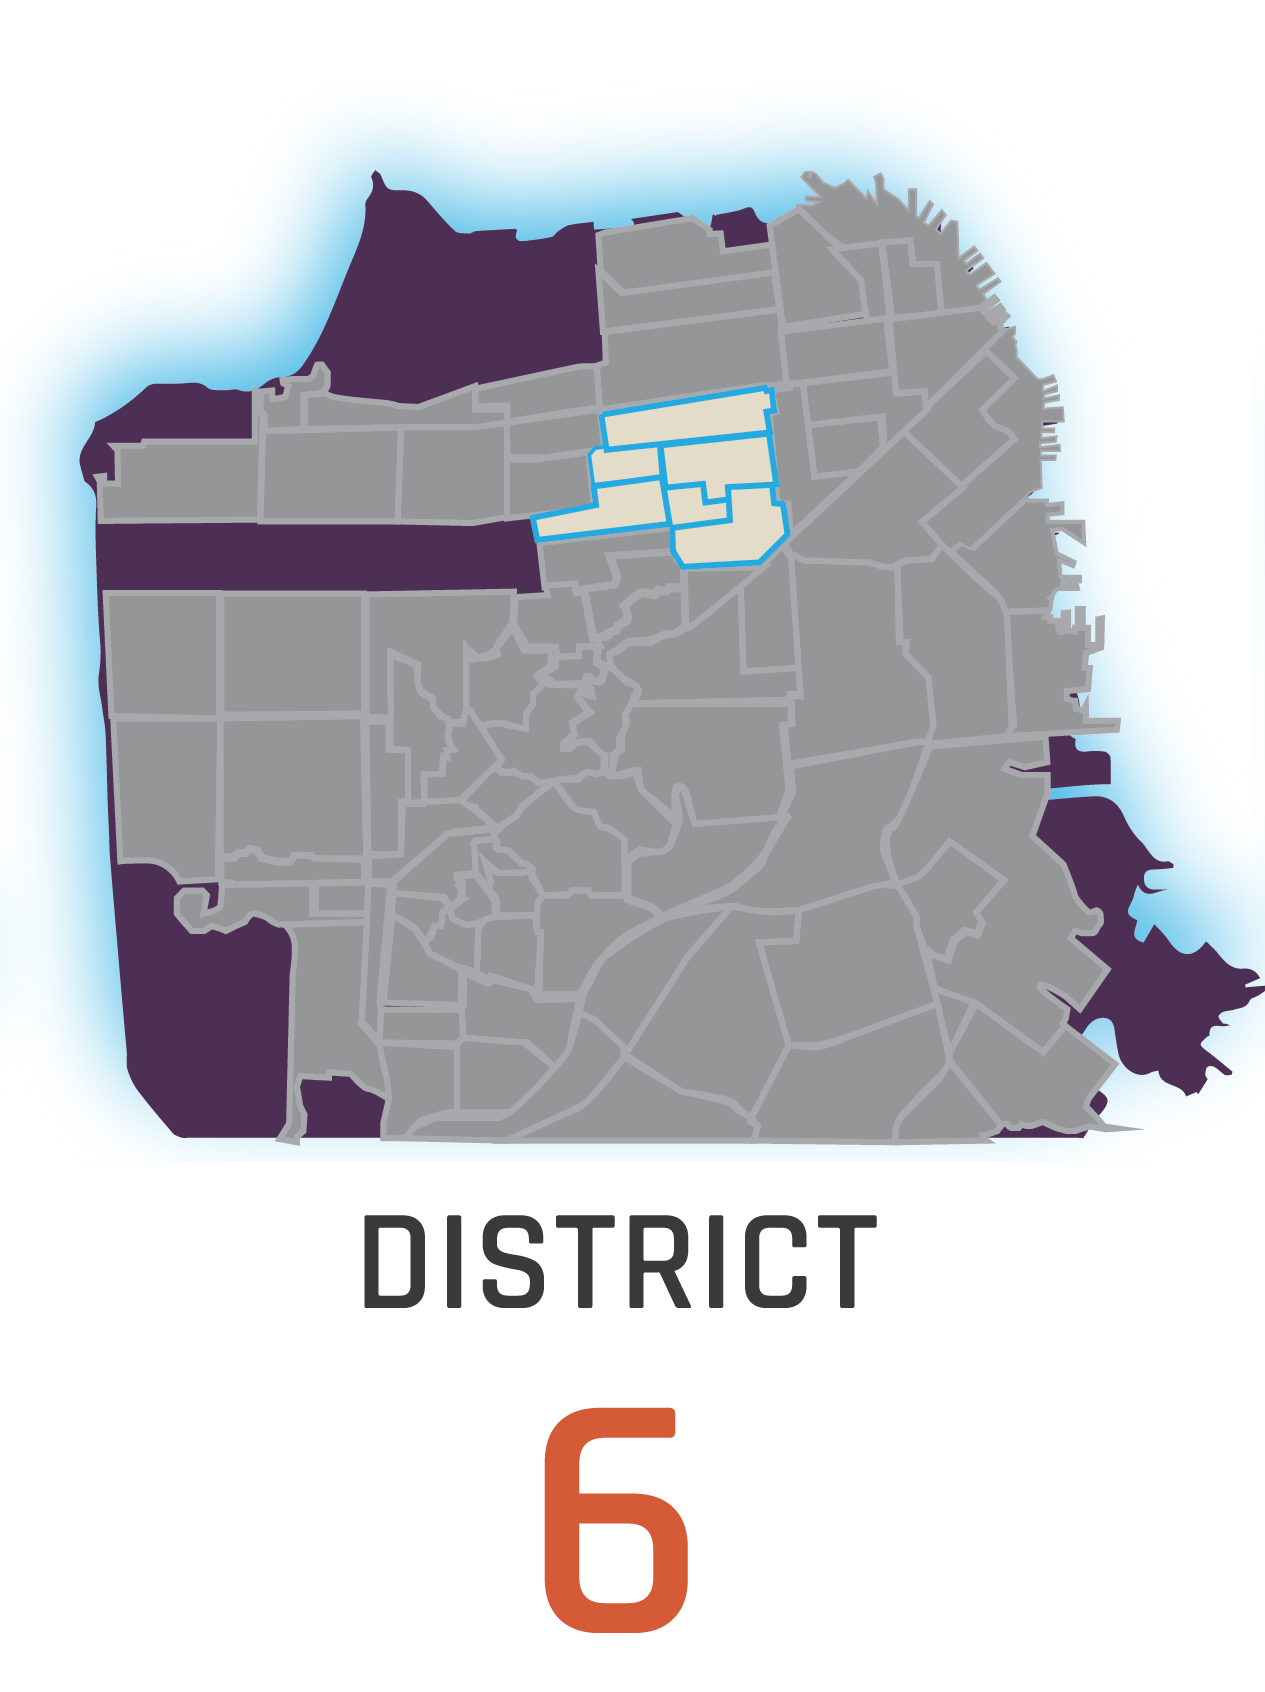
$3.44M
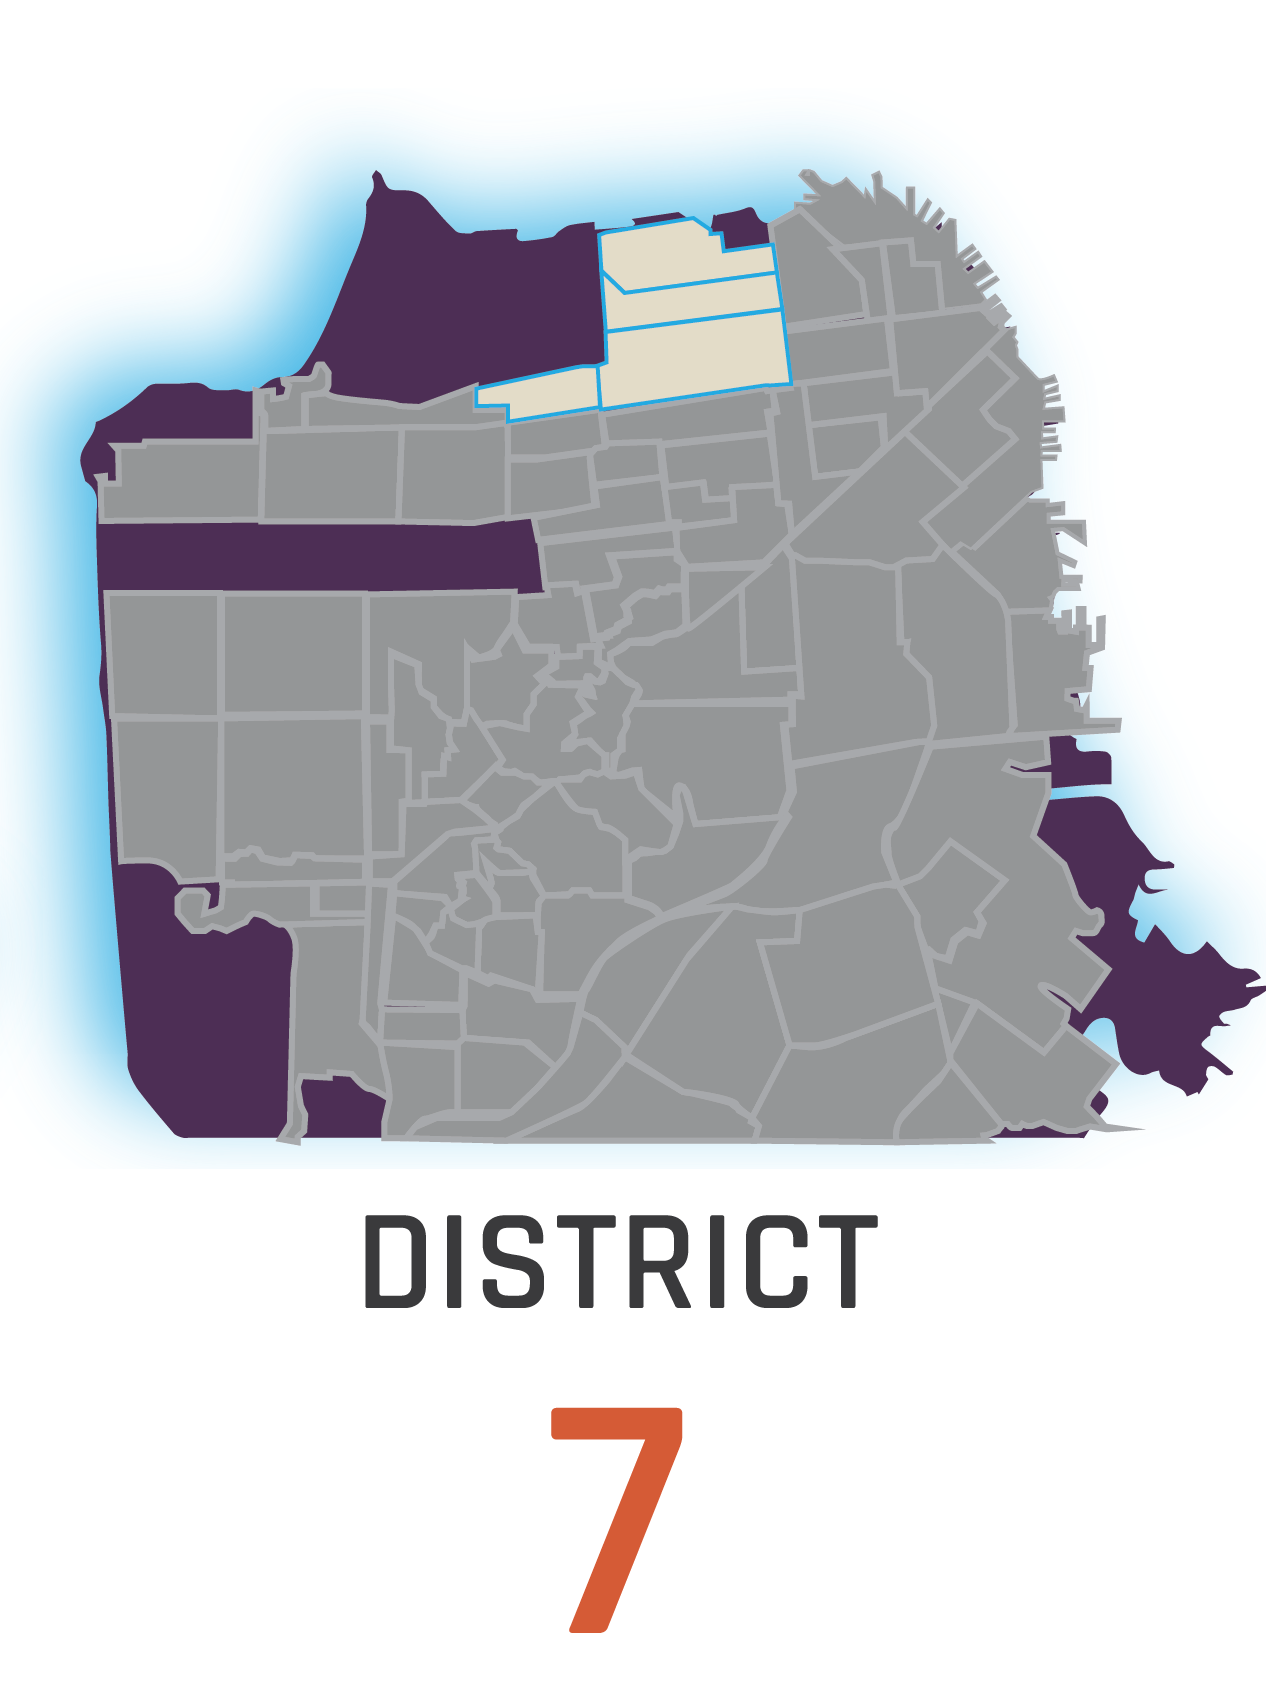
$6.35M
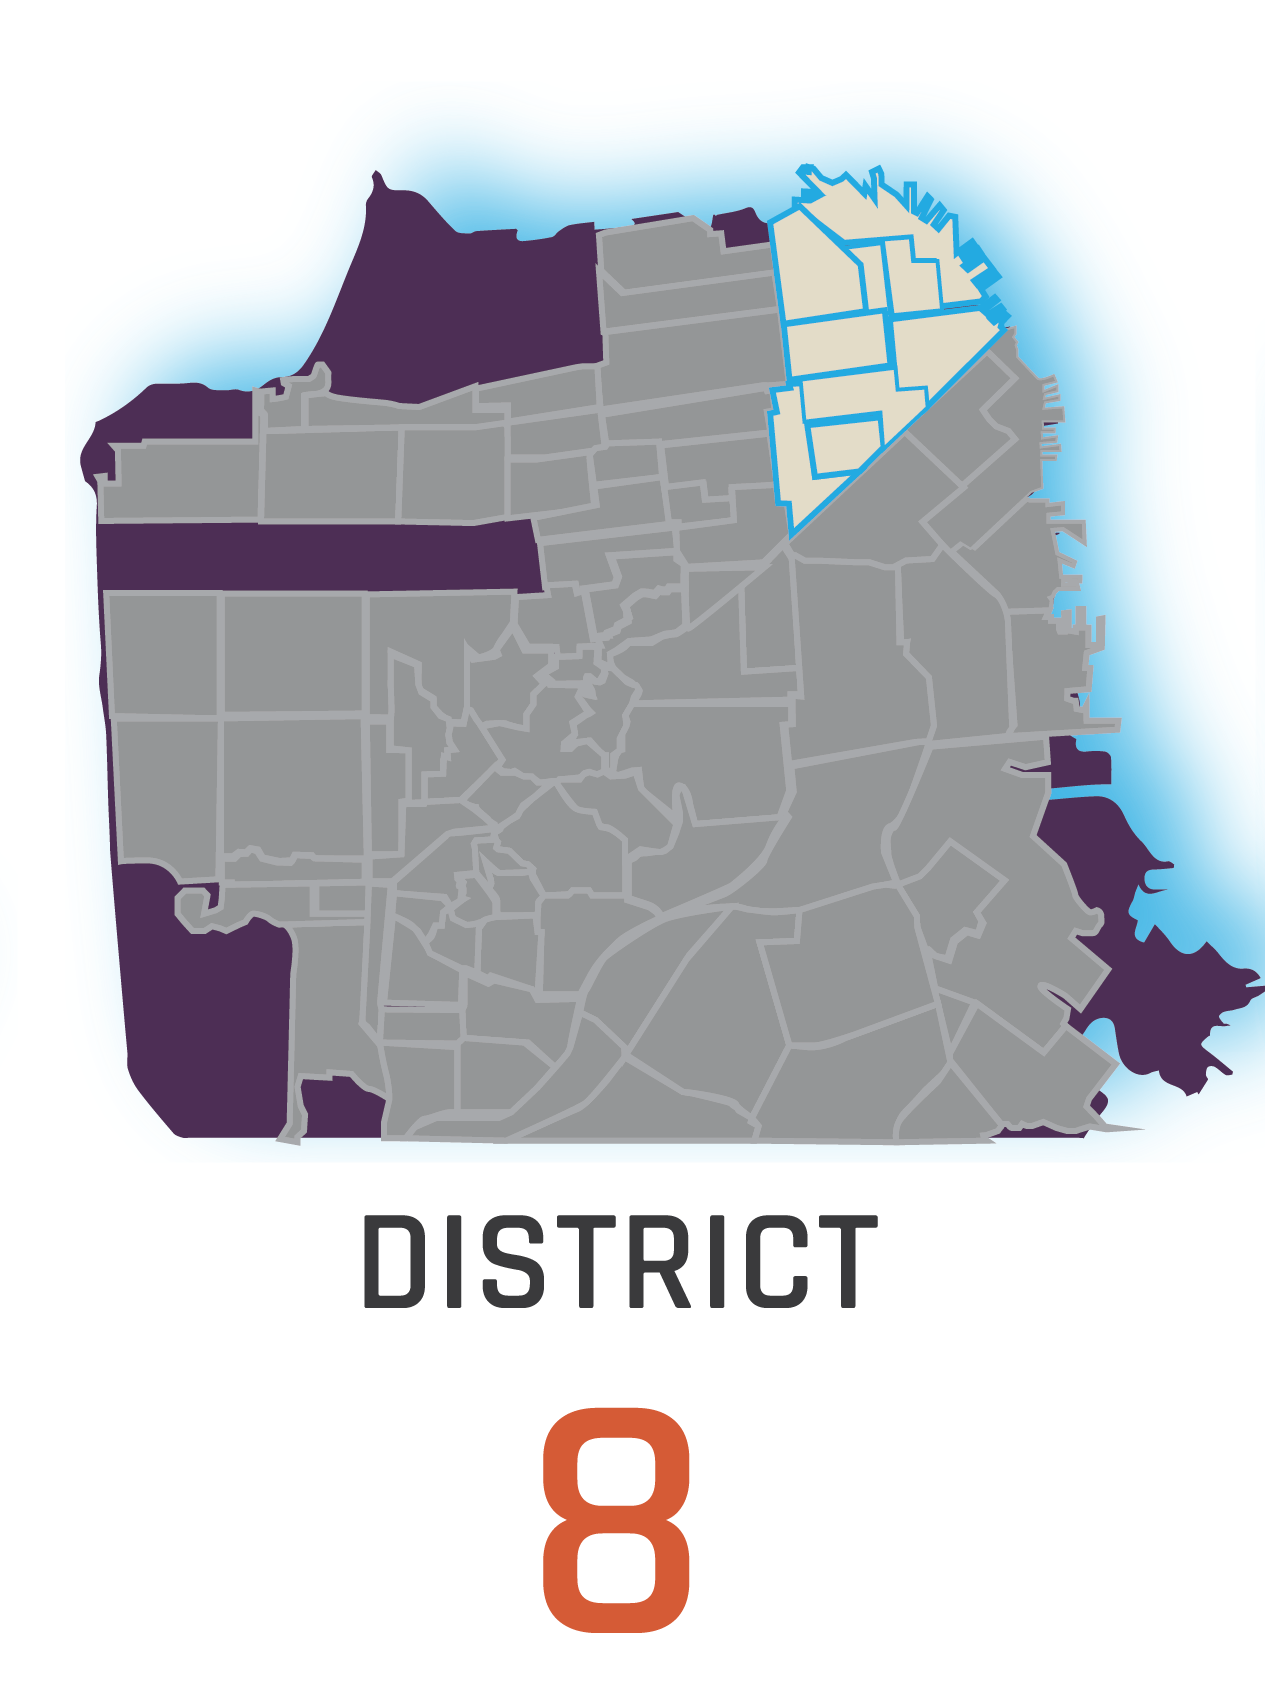
$4.24M
$1.80M
$1.12M
Single-family median sale price by MLS district
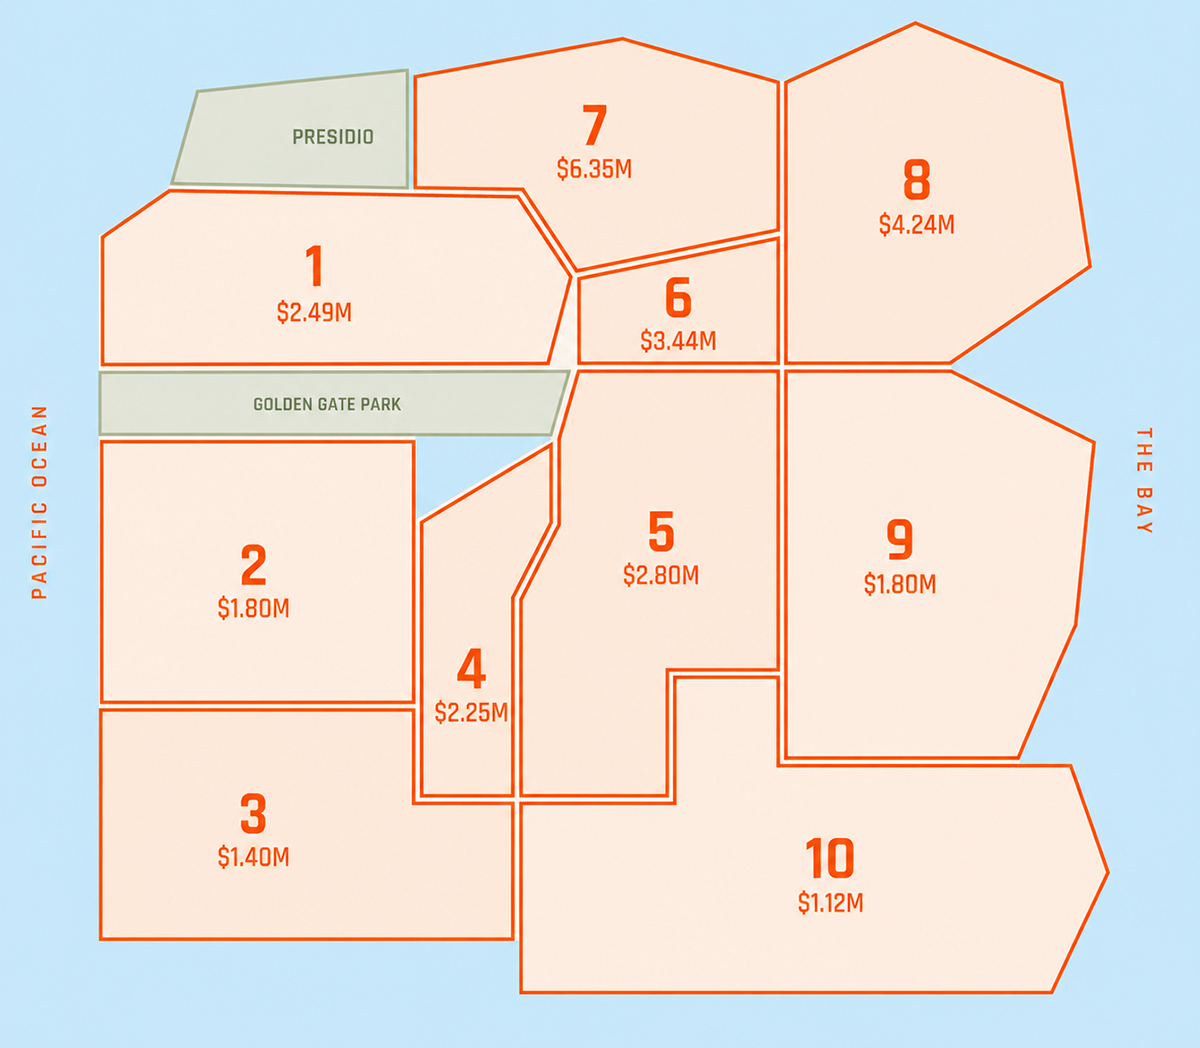
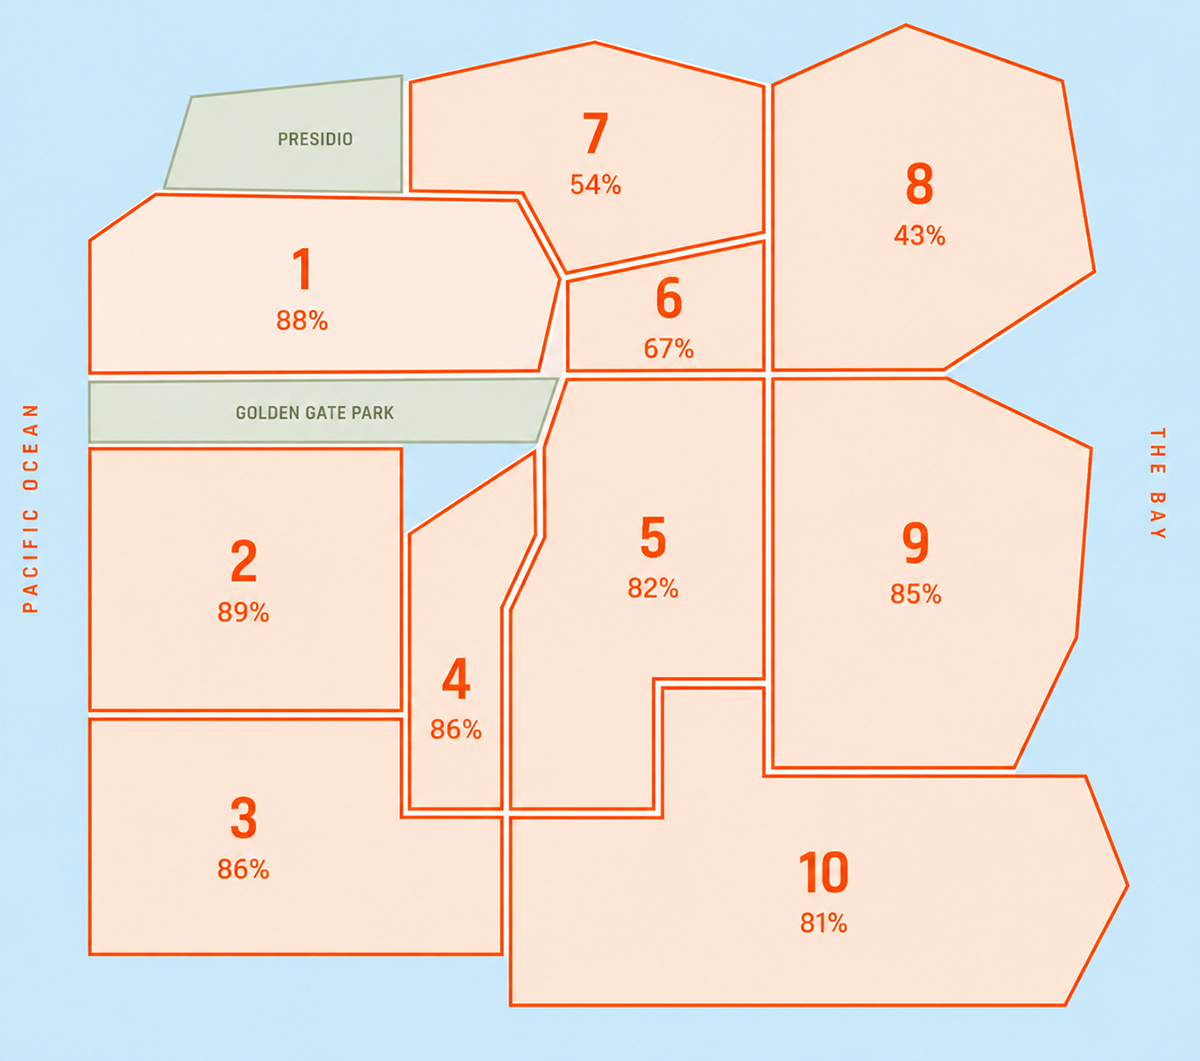
Price and competition are two different maps. The expensive districts are the calm ones; the fight is west of Twin Peaks and out in the Avenues.
Swipe horizontally to view all districts.
Swipe horizontally to view all districts.
District 10 moved the most houses (452) at the most attainable median ($1.124M) — it remains where the City’s first-time house buyers actually land. District 5’s $2.8M median rides on real depth: Noe Valley (5C) alone closed 110 houses at a $2.88M median, with a median $605,000 over list, and Eureka Valley/Dolores Heights (5K) ran $3.48M across 49 sales. At the top of the subdistrict table, Cow Hollow (7D) posted a $7.89M median across 20 sales, edging Pacific Heights (7B) at $6.85M.
Swipe horizontally to view all districts.
Swipe horizontally to view the complete timeline.
A caution on the spring surge: part of that January-to-May climb is mix — heavier high-end volume as the season warms. But the breadth is real: nine of ten districts posted over-list majorities through the spring (District 8, on thin volume, split evenly). This wasn’t one neighborhood carrying the average. July’s early read — $2.13M through the 16th — says the summer hasn’t blinked yet, though a half-month median is a sketch, not a portrait.
| Address | Where | Sold For | Vs. List |
|---|---|---|---|
| 2830 Pacific Ave | District 7B, Pacific Heights | $27,500,000 | At list |
| 2880 Vallejo St | District 7B, Pacific Heights | $26,500,000 | $1.5M over list |
| 2606 Jackson St | District 7B, Pacific Heights | $24,000,000 | $1.5M over list |
| 2626 Larkin St | District 8E, Russian Hill | $24,000,000 | At list |
| 2315 Broadway St | District 7B, Pacific Heights | $22,205,500 | Under list |
Pacific Heights (7B) owns four of the five biggest sales; Russian Hill’s 2626 Larkin St is the outlier at $24M — full price, no theater. On the condo side, the towers still print numbers: 488 Folsom St #5301 closed at $9.845M — under list, which is exactly how the top of the downtown condo market negotiates now.
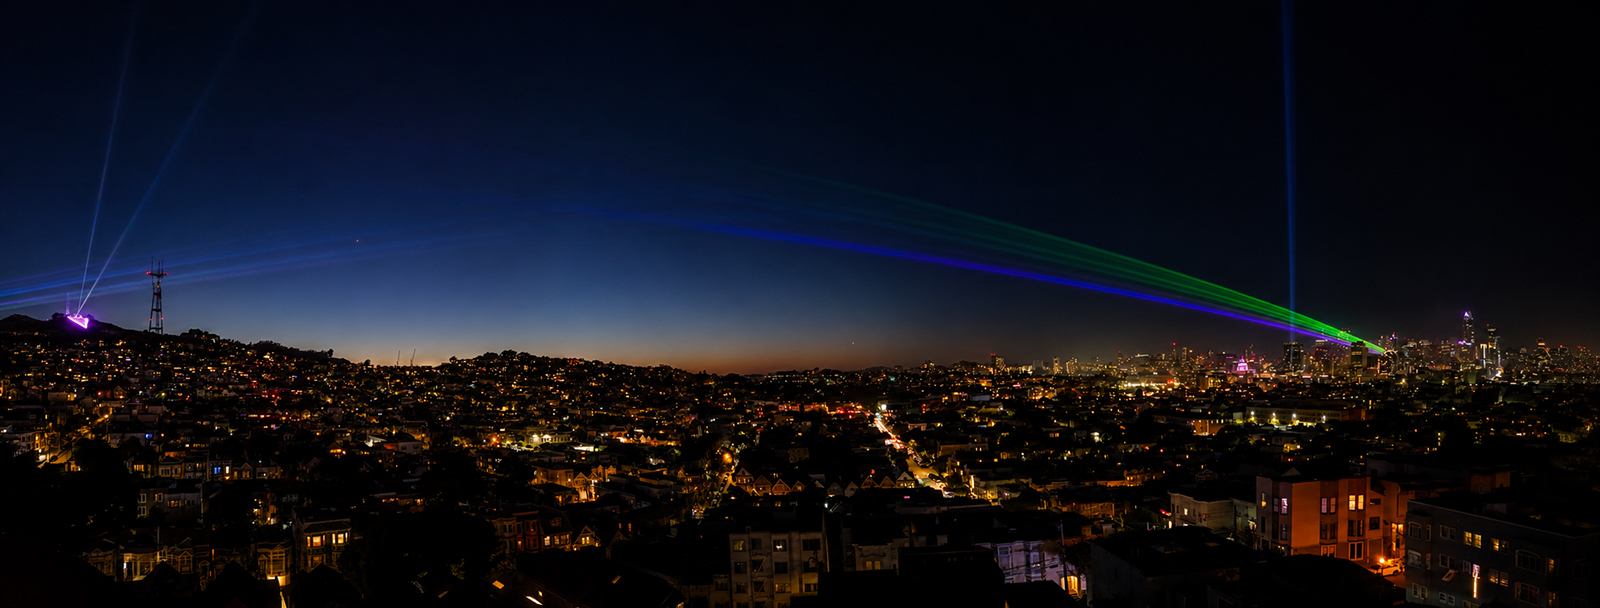
The City, lit up — from Twin Peaks toward downtown.
Swipe horizontally to view all districts.
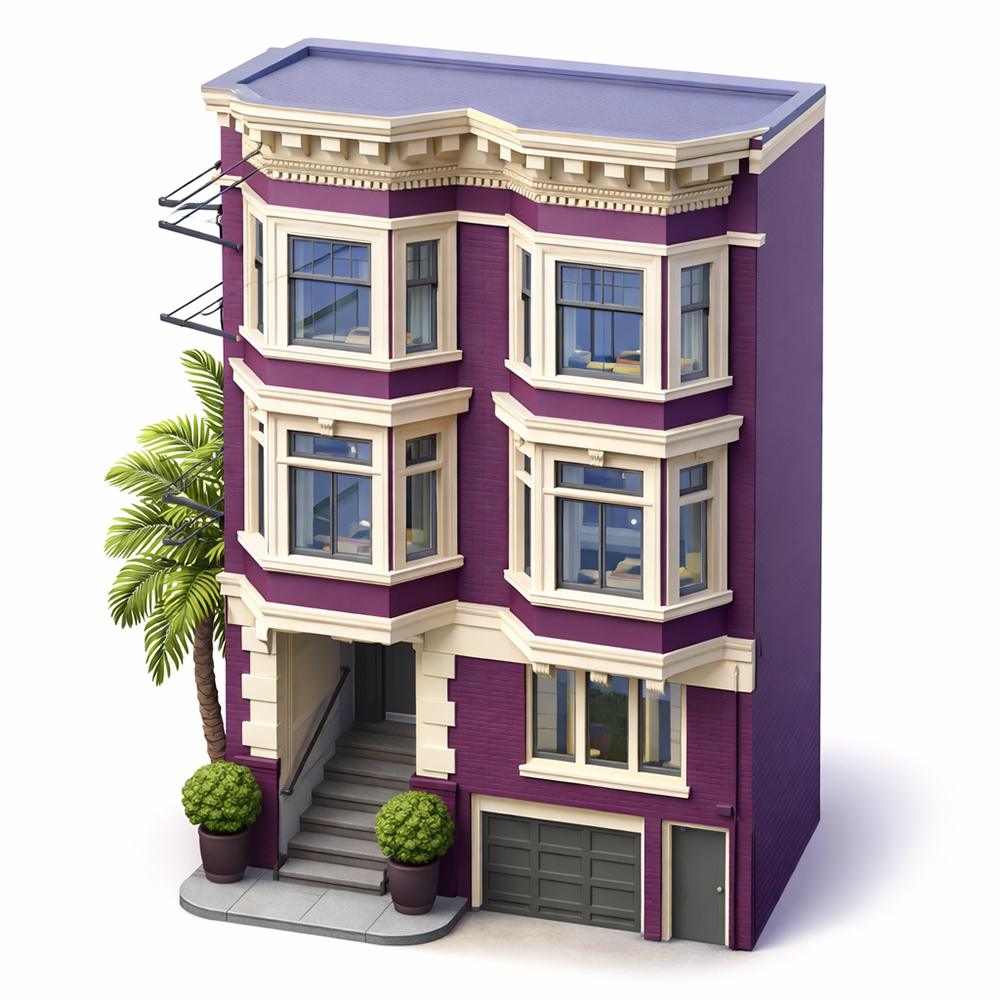
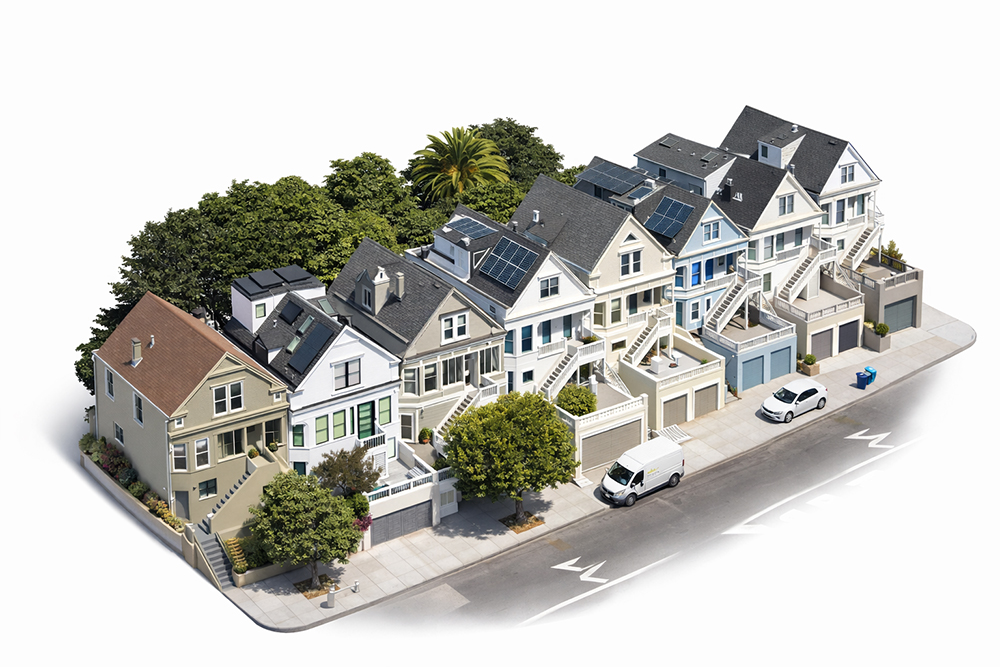
The neighborhood condo — flats & Edwardians
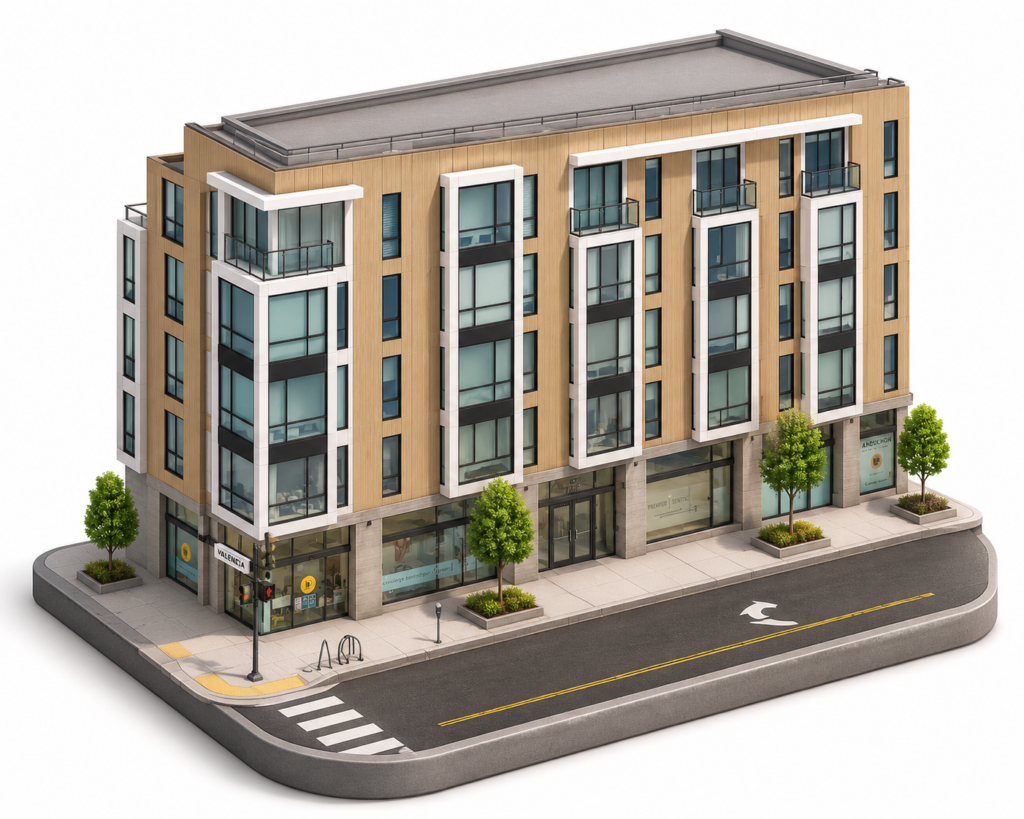
The downtown mid-rise — SOMA & the towers
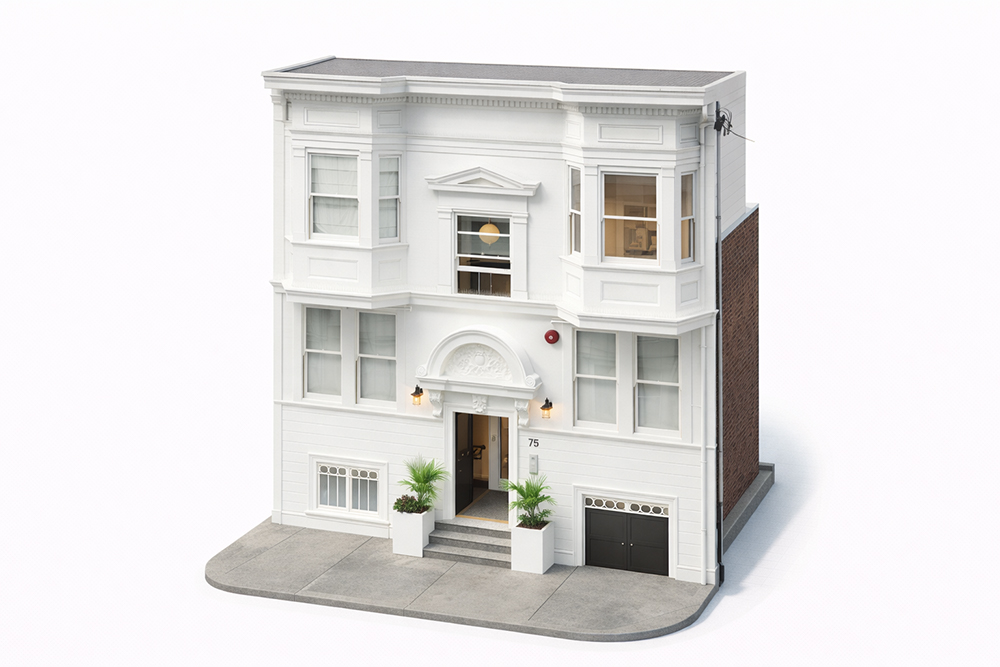
The TIC building — the path to ownership
Citywide, 2,291 condos closed at a $1.185M median — and most sold at or below list, with a 100.0% median list-to-sale. But that average hides two different markets. Neighborhood condos moved like houses: District 5 at $1.50M (72% over list) — led by Cole Valley/Parnassus Heights (5E) at a $1.76M condo median — District 7 at $1.64M, District 1 at $1.50M. Downtown, District 8 posted $1.01M and District 9 $1.02M with only 31–38% closing over list — that’s where a condo buyer still has real leverage, real selection, and 77-day timelines to work with. By size, the ladder was clean: 1-bedrooms at $750K, 2-bedrooms at $1.33M, 3-bedrooms at $1.84M citywide.
312 TIC closings at a $1,090,000 median, 56% over list with a modest $101,000 median premium. TICs remain the City’s honest discount for buyers who understand the structure — priced roughly $95,000 under the citywide condo median for often-larger space.
Same window, all three markets, side by side — because a house in District 2, a condo in District 9, and a TIC in District 5 are three different transactions with three different buyer pools. Over-list medians are among sales that beat list; days-to-close includes escrow.
| Houses | Sales | Median | Med. Over List | % Over List | List-to-Sale | Days to Close |
|---|---|---|---|---|---|---|
| D1 | 185 | $2,488,000 | $522,500 | 88% | 122.3% | 43 |
| D2 | 395 | $1,800,000 | $430,000 | 89% | 128.4% | 43 |
| D3 | 142 | $1,400,000 | $239,556 | 86% | 115.5% | 40 |
| D4 | 300 | $2,245,000 | $390,501 | 86% | 116.8% | 48 |
| D5 | 290 | $2,800,000 | $535,000 | 82% | 121.2% | 50 |
| D6 | 27 | $3,435,000 | $418,000 | 67% | 110.4% | 77 |
| D7 | 99 | $6,350,000 | $800,000 | 54% | 101.6% | 63 |
| D8 | 30 | $4,237,500 | $305,000 | 43% | 100.0% | 72 |
| D9 | 236 | $1,800,000 | $414,600 | 85% | 122.9% | 61 |
| D10 | 452 | $1,124,000 | $170,888 | 81% | 112.2% | 54 |
The house grid splits the City in two: the auction markets (D1, D2, D9 — 85–89% over list, 43–61 days) and the negotiation markets (D7 at 54%, D8 at 43% over list, 63–72 days). Note D2’s 128.4% list-to-sale: the Sunset prices lowest against value and closes fastest.
| Condos | Sales | Median | Med. Over List | % Over List | List-to-Sale | Days to Close |
|---|---|---|---|---|---|---|
| D1 | 95 | $1,500,000 | $162,000 | 68% | 107.3% | 56 |
| D2 | 31 | $1,175,000 | $115,000 | 61% | 103.3% | 70 |
| D3 | 22 | $692,500 | $30,000 | 59% | 101.2% | 89 |
| D4 | 42 | $754,500 | $25,000 | 40% | 100.0% | 94 |
| D5 | 314 | $1,500,000 | $205,000 | 72% | 109.7% | 65 |
| D6 | 230 | $1,246,500 | $163,000 | 58% | 102.4% | 60 |
| D7 | 253 | $1,635,000 | $155,000 | 63% | 103.6% | 61 |
| D8 | 436 | $1,008,750 | $60,000 | 38% | 100.0% | 77 |
| D9 | 823 | $1,020,000 | $55,000 | 31% | 100.0% | 79 |
| D10 | 45 | $709,000 | $11,000 | 31% | 100.0% | 106 |
Condo competition tracks geography, not price point: D5 condos behave like small houses (72% over list); D8 and D9 carry the volume — 1,259 combined closings — at flat 100.0% ratios and 77–79 days. D10 condos took 106 days, the slowest cell on this page.
| TICs | Sales | Median | Med. Over List | % Over List | List-to-Sale | Days to Close |
|---|---|---|---|---|---|---|
| D1 | 27 | $1,000,000 | $200,000 | 63% | 105.8% | 96 |
| D5 | 98 | $1,117,000 | $91,000 | 63% | 102.7% | 63 |
| D6 | 40 | $1,237,500 | $115,000 | 68% | 105.8% | 64 |
| D7 | 33 | $1,420,000 | $176,000 | 58% | 102.2% | 68 |
| D8 | 63 | $915,000 | $50,500 | 38% | 99.6% | 71 |
| D9 | 47 | $894,000 | $86,000 | 51% | 100.1% | 80 |
TICs cluster where the flats are: D5 (98 sales) is nearly a third of the citywide TIC market by itself. Districts 2, 3, 4 and 10 saw a handful or none — too thin to report honestly, so they’re omitted.
Kevin Ho · Team K.Ho, Vanguard Properties
team-kho.com · 415.297.7462 · DRE #01875957
Notes & method. Source: San Francisco MLS, closed sales July 15, 2025–July 16, 2026 (July 2026 partial). Houses, condos and TICs are reported separately, never blended. Over-list figures are dollar medians among sales that closed over list. Days-to-close includes escrow; a well-prepared house sees under two weeks of true public exposure. No living-area field is included in the export, so no $/sqft is quoted. All-cash vs. financed shares are not included in the MLS export; that split lives in Assessor-Recorder deed records and will be added if sourced. Year-over-year comparisons will follow with the matching July 2024–July 2025 export. Each home — and each circumstance — is different; call for specifics.